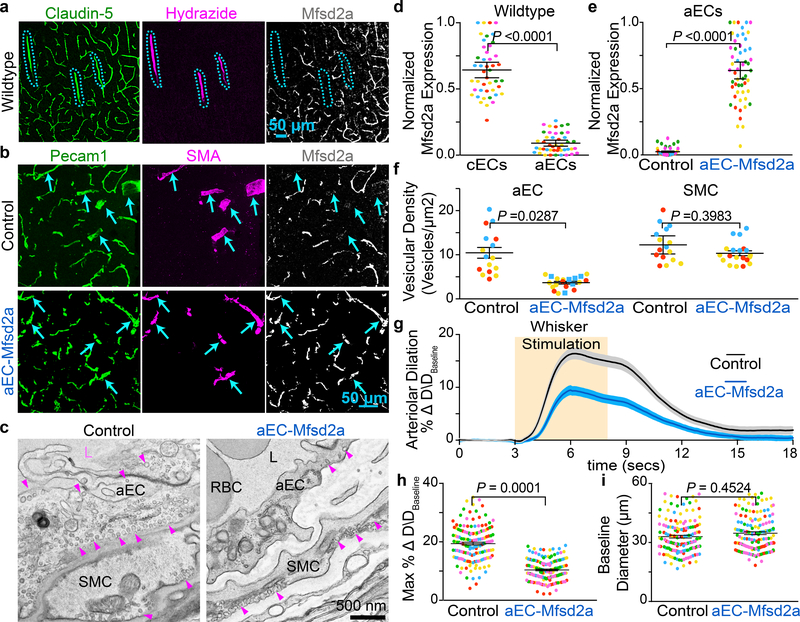
Fig 4. CNS arterioles lack Mfsd2a expression and ectopic expression of Mfsd2a in aECs downregulates caveolae and attenuates neurovascular coupling.
a, Immunostaining for Claudin-5, Hydrazide, and Mfsd2a on wild type adult brain sections demonstrates that Mfsd2a is not detectable in CNS arterioles. Blue hashes outline the Hydrazide+ arterioles. b, Immunostaining on adult brain sections for Pecam1, SMA, and Mfsd2a from control (BMX:CreER−; R26:LSL-Mfsd2a/+) and aEC-specific Mfsd2a overexpression mice (BMX:CreER+; R26:LSL-Mfsd2a/+). Arrowsheads point to SMA+ arteries. d, Quantification of the normalized immunofluorescence of Mfsd2a in cECs (Hydrazide-, Claudin-5+) and aECs (Hydrazide+, Claudin-5+) (n= 5 mice, 45 images) as shown in (a). e, Quantification of normalized immunofluorescence of Mfsd2a in aECs from control (n= 4 mice, 40 images) and aEC-specific Mfsd2a overexpression mice (n=5 mice, 51 images) as shown in (b). c,f, EM images of CNS aECs and SMCs (c) and quantification of the mean vesicular density (f) in aECs and SMCs from control (n= 3 mice, 20 arterioles) and aEC-specific Mfsd2a overexpression mice (n=3 mice, 22 arterioles). L, Lumen. SMC, smooth muscle cell, arrowheads point to caveolae. g,h,i, Time-course of change in arteriolar dilation (g) and max % change in arteriolar dilation (h) and baseline diameter (i) in control (n= 7 mice, 260 arterioles) and aEC-specific Mfsd2a overexpression mice (n= 5 mice, 193 arterioles. Statistical significance was determined by nested, unpaired, two-tailed t-test for (d,e,f,h,i). Data shown as mean ± s.e.m.

