Figure 1.

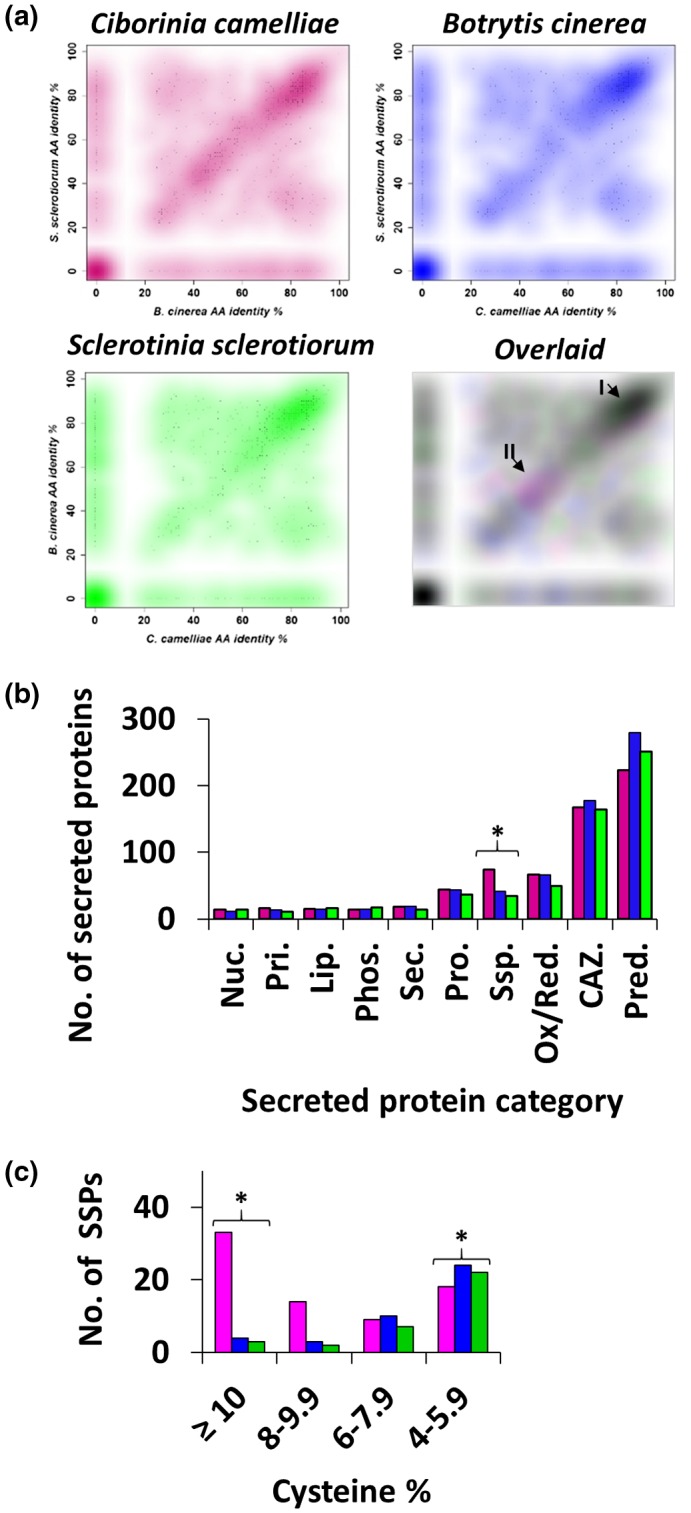
Prediction and comparative analyses of the secretomes of Ciborinia camelliae (pink), Botyrtis cinerea (blue), and Sclerotinia sclerotiorum (green). (a) Scatterplot analysis of the secretomes of C. camelliae, B. cinerea, and S. sclerotiorum. Predicted secreted proteins from each fungal pathogen were aligned to predicted secreted proteins from the other two fungal pathogens using BLASTP. Each query sequence produced two “best hit” amino acid (AA) identity scores. Three graphs were independently generated and were overlaid for comparison. I, a cluster of highly conserved proteins; II, a dominant cluster of C. camelliae‐specific proteins. (b) A comparison of the annotated fungal secretomes of C. camelliae, B. cinerea, and S. sclerotiorum. Raw counts represent the number of proteins in each gene ontology category. The top 10 most common categories are shown. Nuc., nucleic acid modification proteins; Pri., primary metabolism proteins; Lip., lipases; Phos., phosphatases; Sec., secondary metabolism proteins; Pro., proteases; SSP., small secreted proteins; Ox/Red., oxidoreductases; CAZ., carbohydrate‐active enzymes; Pred., predicted proteins. (c) A histogram displaying the distribution of SSPs for each species based on their cysteine content. Asterisks indicate statistical differences (Fisher's exact test using a 3 × 2 contingency table) (p < .001)
