
Figure 1.
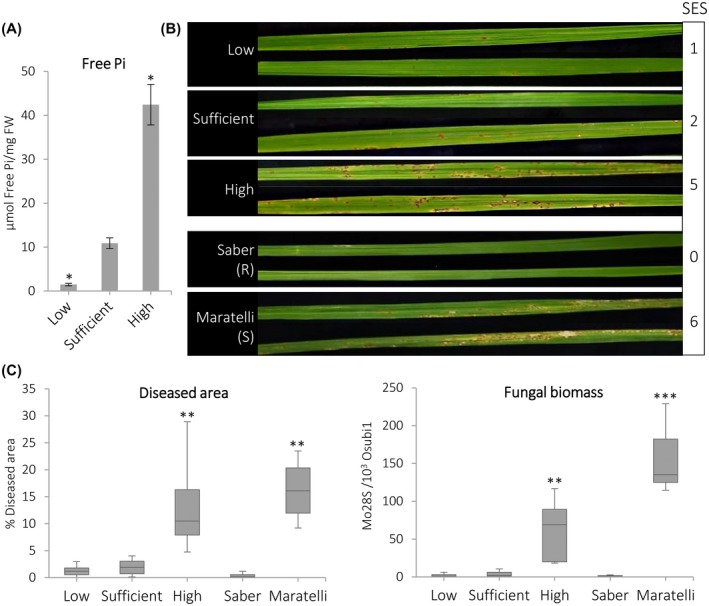
Susceptibility to infection by Magnaporthe oryzae in rice plants (Oryza sativa ‘Tainung 67’) grown under high‐Pi supply. (a) Free Pi content in leaves of rice plants grown under low, sufficient, or high Pi for 15 days (three‐ to four‐leaf stage). Bars represent mean ± SEM of four biological replicates with three plants per replicate. Comparisons have been made relative to the sufficient Pi condition (t test, *p < .05). (b) Disease symptoms at 7 days post‐infection (dpi) of low‐, sufficient‐, or high‐Pi treated plants. Representative results from one of three independent experiments that produced similar results are shown. Reference cultivars used were Saber (resistant) and Maratelli (susceptible). Standard evaluation system (SES) values are indicated on the right. (c) Percentage of diseased leaf area at 7 dpi (15 leaves per Pi treatment) (left panel). All the treatments were compared to the sufficient Pi supply (Wilcox test, **p ≤ .001). Fungal biomass was quantified at 7 dpi by quantitative PCR analysis using specific primers of M. oryzae Mo28S (right panel) and normalized to rice Ubiquitin 1 gene (eight biological replicates per Pi treatment). Comparisons have been made relative to the sufficient Pi supply (t test, **p ≤ .005, ***p ≤ .0001)