
Figure 5.
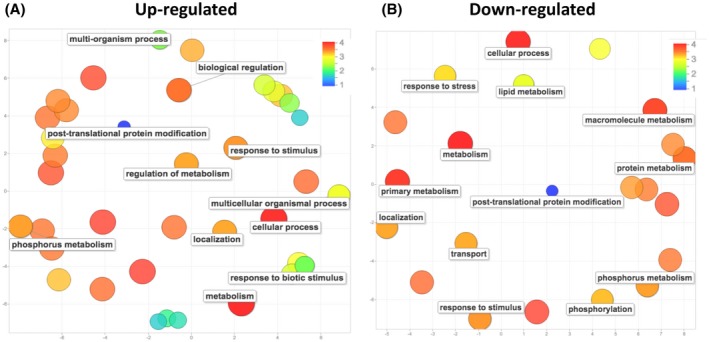
Gene ontology (GO) enrichment analysis of differentially expressed genes in miR399 overexpressing (OE) plants relative to wild‐type plants. The top GO terms enriched in miR399 OE plants were represented by using REVIGO after reducing redundancy (http://revigo.irb.hr/). (a) and (b) represent up‐regulated and down‐regulated genes, respectively. Circles represent GO terms and those clustered closer to each other represented similar GO terms. Circle colours (blue to yellow) represent the degree of GO enrichment (p value) and size is proportional to the frequency of the GO term in the GO database (larger and smaller discs represent more general and more specific terms, respectively)