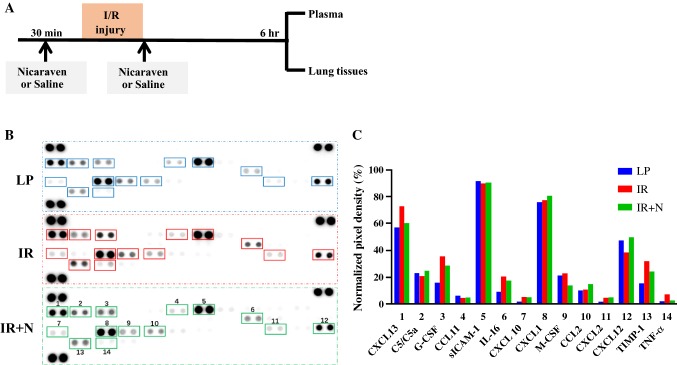
Fig. 3.
Detection of inflammatory cytokines in plasma by Proteome Profiler™ array. a Schematic diagram about the timeline of the experimental protocol. b Representative images on the expression of 40 cytokines/chemokines in plasma of mice received laparotomy and saline injections (LP), intestinal I/R injury and saline injections (IR), or intestinal I/R injury and nicaraven administration (IR + N). c Bar graph shows the semiquantitative data about the indicated cytokines/chemokines. Data represent as normalized pixel density

