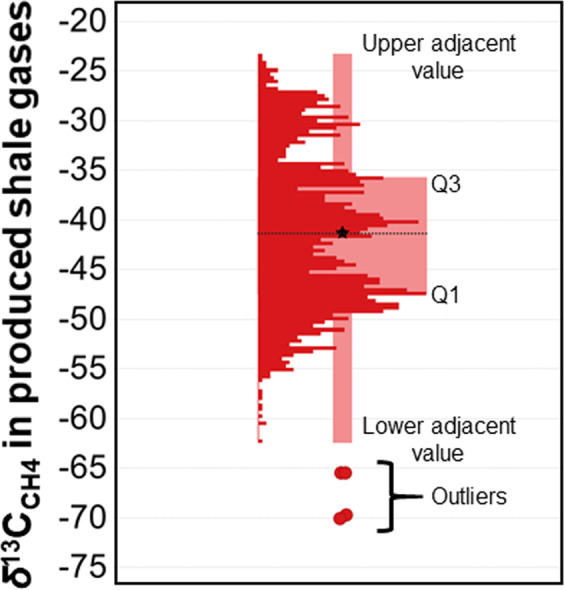
Figure 1.

δ13CCH4 values from a global dataset of 1619 samples of produced shale gases from around the world. The data are displayed using a box plot, which shows distribution of values as histogram, average (mean) value (−41.3‰) as black star, median value (−41.4‰) as dotted line, first quartile (Q1), third quartile (Q3), lower adjacent value, upper adjacent value, and outliers. The first quartile (Q1) is the median of the lower half of the data set. This means that about 25% of the values in the data set lie below Q1 and about 75% lie above Q1. The third quartile (Q3) is the median of the upper half of the data set. This means that about 75% of the values in the data set lie below Q3 and about 25% lie above Q3. The lower adjacent value is the smallest observation that is greater than or equal to the lower inner fence, which is the first quartile minus 1.5 × IQR, where IQR stands for the interquartile range. The upper adjacent value is the largest observation that is less than or equal to the upper inner fence, which is the third quartile plus 1.5 × IQR. Outliers are all values that fall outside of either of the fences. Original data are in Table S1.
