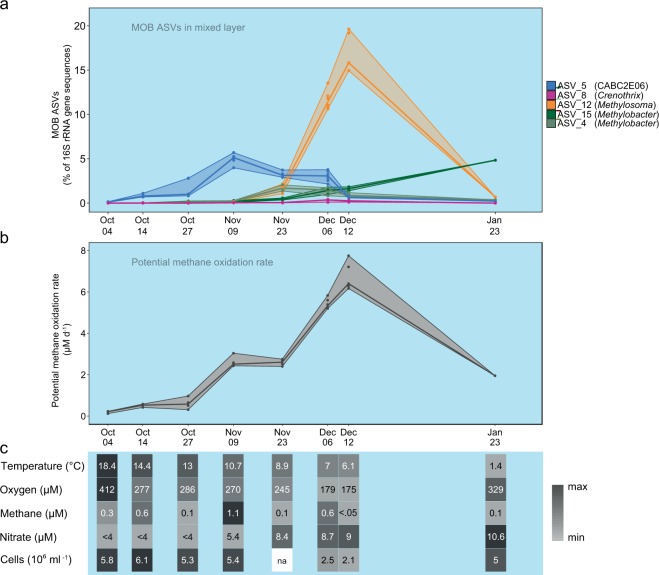
Fig. 3. Mixed layer dynamics during lake overturn.
The minimum, maximum and median were derived from separately measured samples from different depths of the mixed layer. a MOB assemblage dynamics of the five most common ASVs within the expanding mixed layer during lake overturn. Maximum, minimum and median relative abundance of each MOB ASV within the mixed layer are visualized with lines. Colors correspond to MOB ASVs. b Dynamics of potential methane-oxidation rates during lake overturn. Lines depict maximum, minimum and median within the mixed layer. c Heatmap illustrating the corresponding change in physical, chemical and biological environmental parameters in the mixed layer over time. The median of the mixed layer samples is shown for each parameter and sampling date. Shades of grey are scaled between minimum (light grey) and maximum (black) values. Values below the limit of quantification are marked with “<” and missing data with “na”. Raw data and sample size for b and c are provided in Supplementary Table 2.

