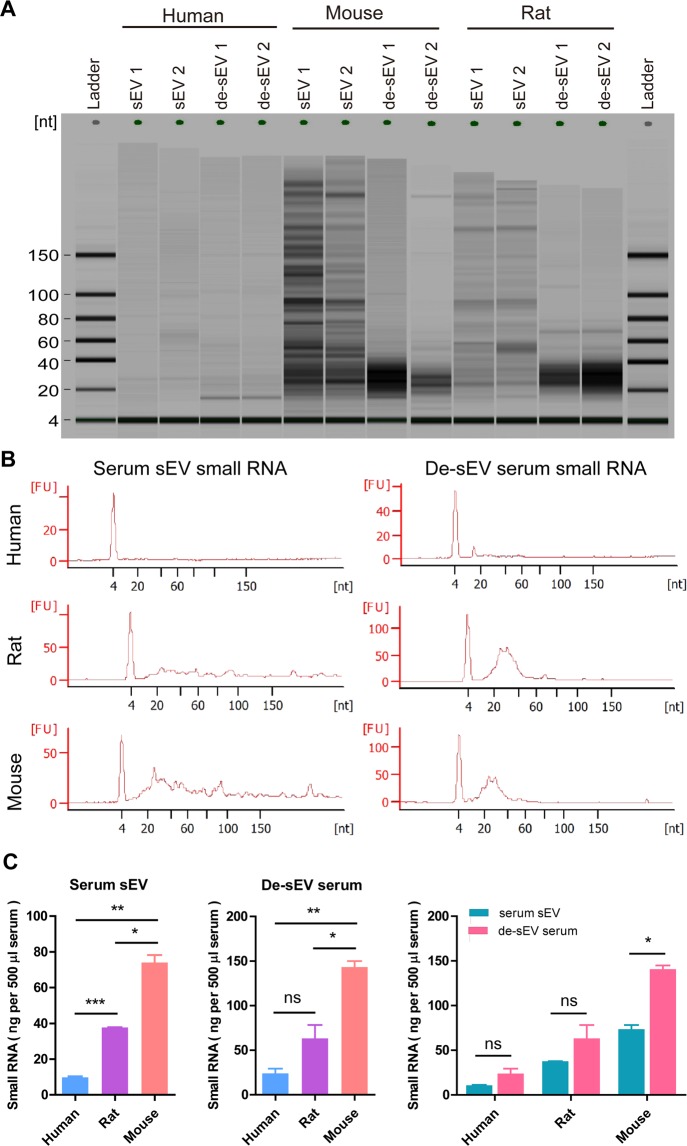
Figure 2.
The length distribution and concentration of small RNAs in serum sEV and de-sEV serum samples from human, rats and mice as detected by Agilent 2100 Bioanalyzer using small RNA chips. (A) Gel-like image of all the samples with biological replicates. (B) For each group, electropherograms for one of the two biological replicates was provided. (C) The concentrations of small RNA (0–296nt) in serum sEV from human, rat and mouse, human vs. rat, ***P = 0.0003; human vs. mouse, **P = 0.0053; rat vs. mouse, *P = 0.0159; de-sEV serum, human vs. rat, P > 0.05, ns; human vs. mouse, **P = 0.0052; rat vs. mouse, *P = 0.0397; the concentrations of small RNA in serum sEV vs. de-sEV serum, human, P > 0.05, ns; rat, P > 0.05, ns; mouse, *P = 0.0134. sEV, small extracellular vesicle; de-sEV, small extracellular vesicle depleted.

