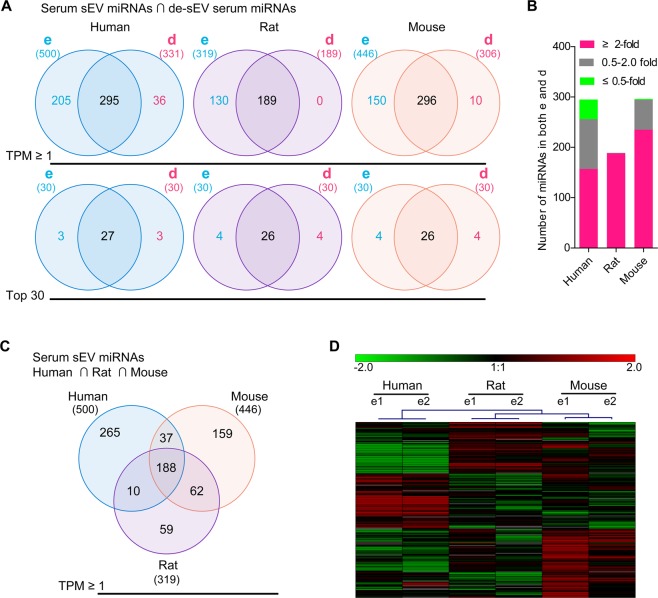
Figure 6.
The expression of miRNAs in serum sEV vs. de-sEV serum, and the expression of miRNAs in serum sEV between species. (A) The venny diagram depicts the common and unique miRNAs identified in serum sEV miRNAs and de-sEV serum miRNAs from human, rat and mouse, respectively. (B) The composition of miRNAs based on the relative expression of serum sEVs vs. sEV-depleted serum, only those miRNAs existed both inside and outside of serum sEV were included. (C) The venny diagram depicts the common and unique miRNAs identified in serum sEV miRNAs from human, rat and mouse. (D) Heat map of hierarchical clustering of the 188 common serum sEV miRNAs between species based on log2 transformed TMP (transcripts per million reads). Each column represents an individual sample, each row represents an individual miRNA. miRNAs were ordered by Pearson correlation and complete linkage. TPM, transcripts per million reads; sEV, small extracellular vesicle; de-sEV, small extracellular vesicle depleted; e, serum small extracellular vesicle; d, small extracellular vesicle depleted serum.

