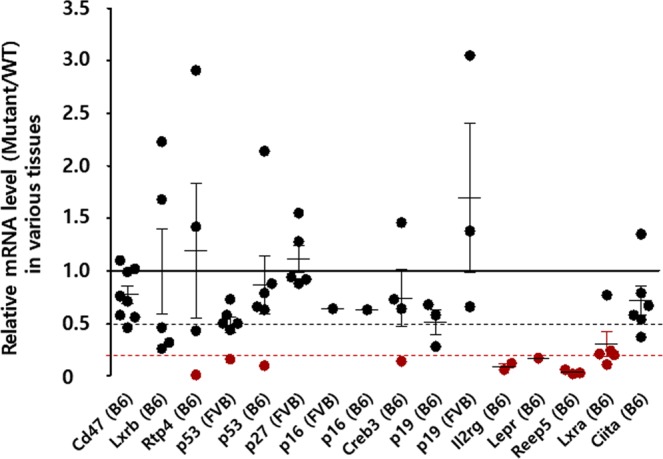
Figure 1.

The mutant/WT ratios of the mRNA expression levels for each target gene in sixteen mutant mouse strains carrying frameshift mutations. Gene expression in different tissues of each mouse was determined using quantitative PCR (qPCR). Each closed black circles represents the target gene expression in mutant mice relative to that in WT mice in the tissues that were tested. The closed red circles indicate that the expression of target gene in mutant mice is less than 20% relative to that in WT mice. The X-axis is ordered from the shortest to the longest distance from ATG of each target gene to their indel. The middle horizontal lines in each gene of the whisker plot represent the median gene expression ratios. The dotted black line indicates 50% mutant/WT ratio, and the dotted red line indicates 20% mutant/WT ratio.
