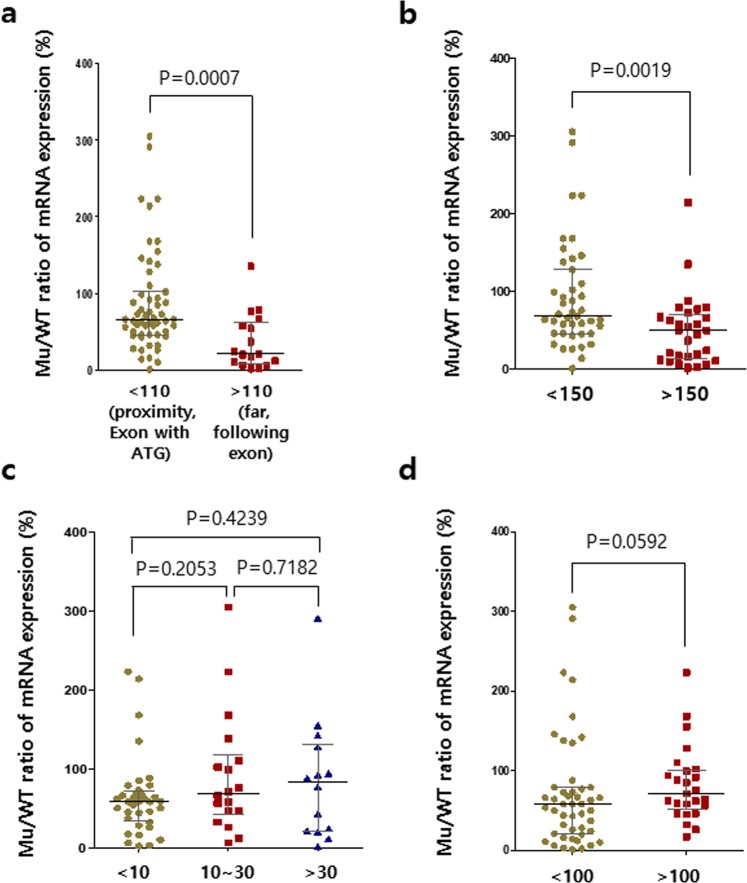
Figure 4.
Target regions and distances from ATG codon to the PTC influence the efficiency of mutant mRNA decay (mutant mRNA levels/WT mRNA levels). The Mu/WT ratios of mRNA expression levels for target gene in each tissue are shown. (a) The efficiencies of mRNA decay are differentially influenced by the target regions: Proximity to ATG (<110 bp), far from ATG (>110 bp). (b) The influence of distance from the ATG codon to the PTC on the efficiency of mRNA decay. PTCs are located within 150 bp downstream from ATG (<150) or at distance of over 150 bp from ATG (>150). (c) The influence of the number of deleted nucleotides on the efficiency of mRNA decay. The Mu/WT ratios of mRNA expression levels for the target genes in each tissue are shown for each range of deletion lengths. Deletion lengths are less than 10 bp (<10 bp), from 10 to 30 bp (10~30), or over 30 bp (>30). (d) The distance from the PTC to the next EJC influences the efficiency of mRNA decay. PTCs are located within 100 bp upstream from the next EJC (<100) or at a distance of over 100 bp from the next EJC (>100). The central lines represent the median gene expression ratio. p values are from two-tail Mann-Whitney tests. Mu, Mutant.

