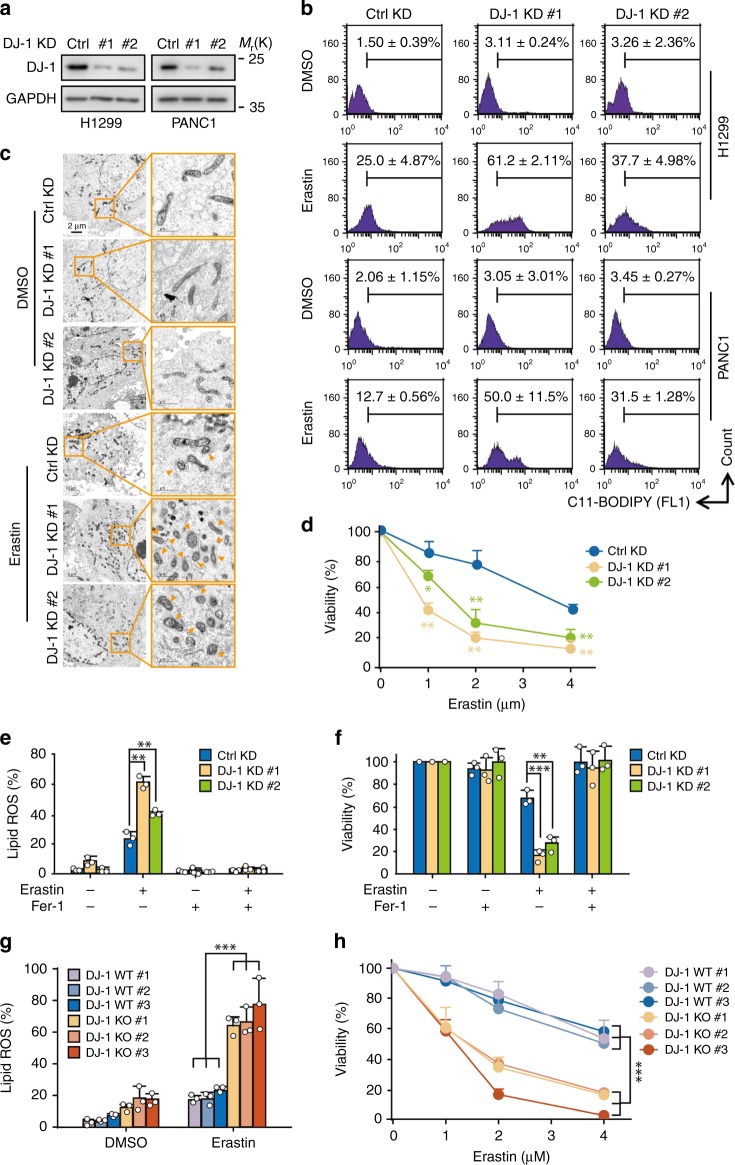
Fig. 1. DJ-1 KD enhances ferroptotic cell death.
a Western blot analysis of DJ-1 expression in indicated DJ-1 KD H1299 and PANC1 cells. Independent experiments are repeated three times and representative data are shown. b Indicated KD H1299 and PANC1 cells were treated with erastin (2 μM) for 12 h, and lipid ROS production was assayed by flow cytometry using C11-BODIPY. Representative data are shown and the statistical analysis is from three independent experiments. c Representative transmission electron microscopy images of control KD or DJ-1 KD H1299 cells treated with erastin (2 μM, 12 h). A minimum of ten cells per treatment condition were examined. Orange triangle representative’s shrunken mitochondria. Independent experiments are repeated three times and representative data are shown. d Indicated DJ-1 KD H1299 cells were treated with erastin (1–4 μM) for 36 h, and cell viability was assayed. e Indicated DJ-1 KD H1299 cells were treated with erastin (2 μM) with or without ferrostatin-1 (Fer-1, 1 μM) for 12 h, and lipid ROS production was assayed. f Cell viability was assayed in indicated DJ-1 KD H1299 cells treated for 36 h with erastin (2 μM) with or without Fer-1 (1 μM). g DJ-1 WT and KO H1299 cells were treated with erastin (2 μM) for 12 h, and lipid ROS production was assayed. h Cell viability was assayed in indicated DJ-1 WT and KO H1299 cells treated for 36 h with erastin (1–4 μM). Data shown represent mean ± SD from three independent experiments. Comparisons were made using the two-tailed, unpaired Student’s t-test; *p < 0.05, **p < 0.01, ***p < 0.001.

