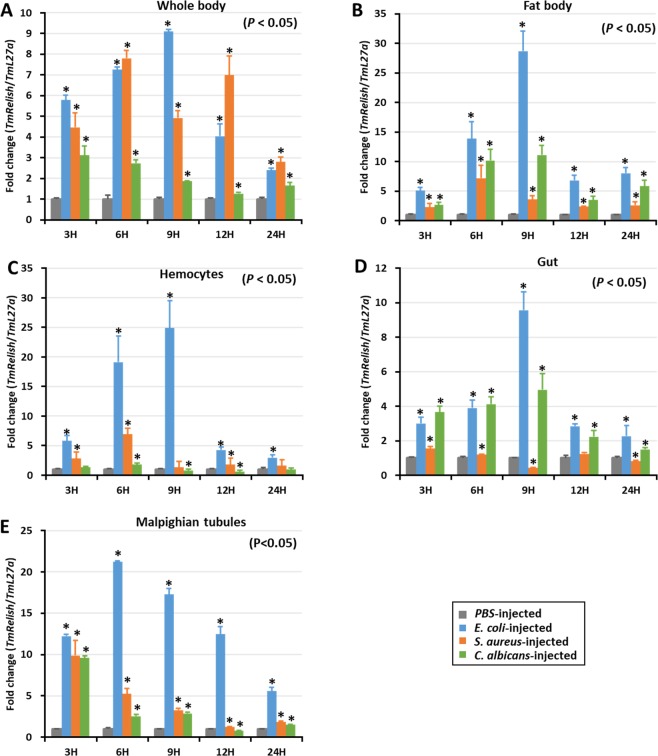
Figure 4.
TmRelish expression profiles of the whole body (A), fat body (B), hemocytes (C), gut (D), and Malpighian tubules (E) after Escherichia coli, Staphylococcus aureus, and Candida albicans infection, measured by qRT-PCR. T. molitor 60S ribosomal protein L27a (TmL27a) was used as an internal control. Expression levels of TmRelish in PBS-injected mock controls was set to 1. Vertical bars represent the mean ± SE (n = 20). ‘*’ indicates significant difference (p < 0.05).

