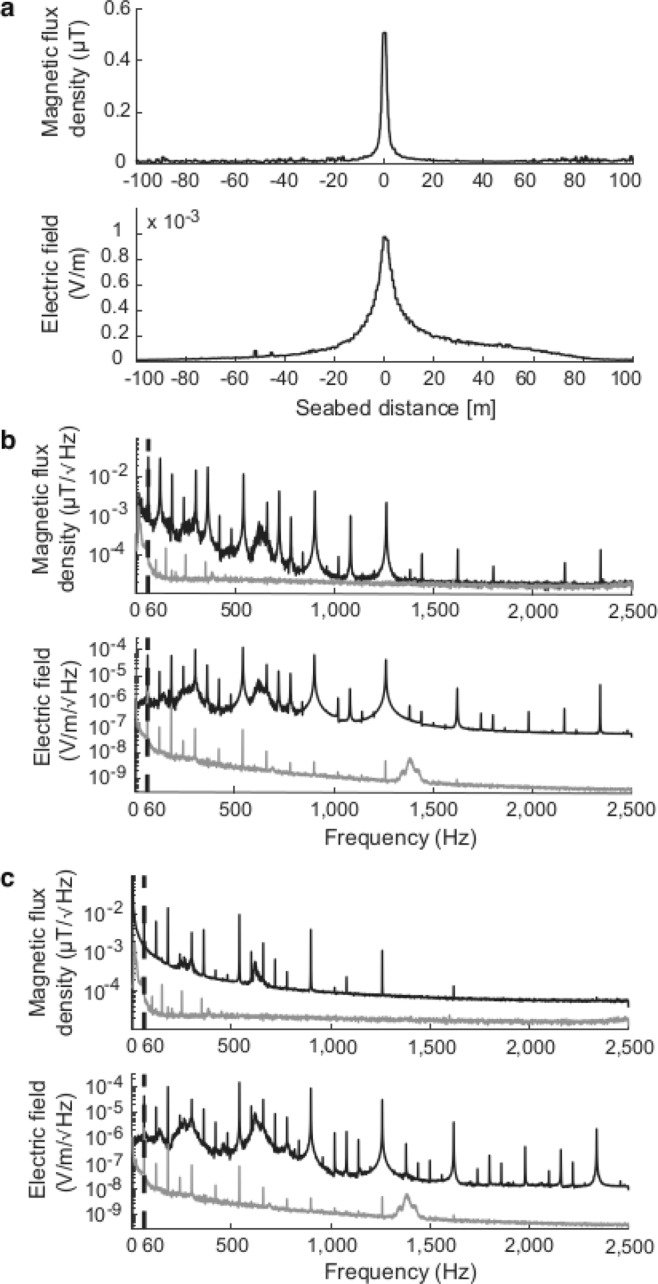
Figure 5.

The spatial extent and harmonics of the AC fields, exemplified by the CSC. (a) The spatial extent of the measured AC fields; the total magnetic AC field (upper) and the total electric AC-field (lower). (b) The estimated spectra from the Power Spectral Densities (PSD for transect 7, black lines) during operation at 345 A; the magnetic field (upper) and the electric field (lower). The grey lines show measured background levels. (c) The estimated spectra from the PSD of transect 5 when the CSC was not transferring power but had an electric current of 16 A. In (b,c), the upper panel shows the magnetic AC field (black) and the lower panel the electric AC field (black). Both have the main frequency of 60 Hz identified by a dotted line and the grey lines in (b,c) show the background levels obtained at the reference site (358 m from the cable).
