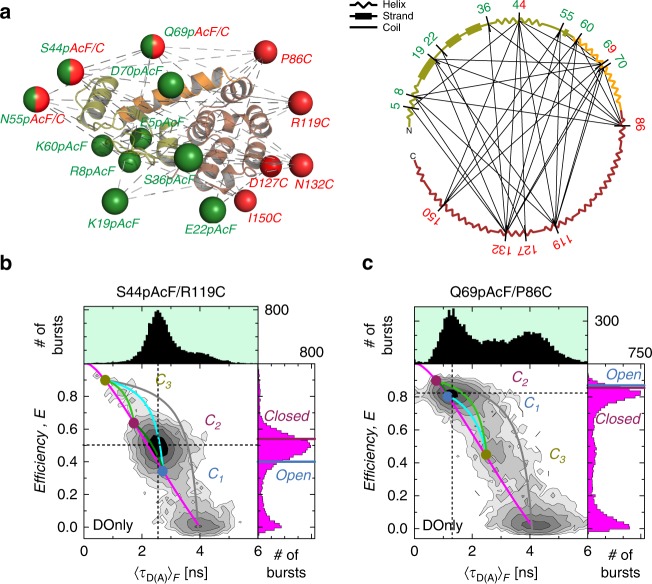
Fig. 2. FRET studies probe T4L structure and dynamics.
a Network representing 33 measured distinct FRET-variants of T4L. The donor (D) Alexa488-hydroxylamine and acceptor (A) Alexa647-maleimide are coupled to para-acetylphenylalanine (pAcF) and cysteine (C), respectively. The spheres in the left panel represent the average donor (green) and acceptor (red) position for a structure of T4L (PDB ID: 172L) that is determined by the FRET Positioning System (FPS)10. Positions 44, 55, and 69 are used for donor and acceptor labeling. Right panel shows the secondary structure elements (helix, strand or coil) of T4L. The labeling positions are indicated and network pairs are connected. The N-terminal lobe is shown in green, the connecting helix c in orange and the C-terminal lobe in brown. b, c The FRET-efficiency, E, and fluorescence lifetime of D in the presence of A, 〈τD(A)〉F, of the DA-labeled T4L variants (b) S44pAcF/R119C and (c) Q69pAcF/P86C are shown in two-dimensional MFD-histograms (center) with one-dimensional projections of E (right) and 〈τD(A)〉F (top). The magenta lines (static FRET-line) describe those molecules with a single conformational state. The limiting states (circles) of the dynamic FRET-lines (C1, blue; C2, purple; C3, yellow) are identified by eTCSPC (Supplementary Methods, Supplementary Note 4). The dynamic FRET-lines are shown in dark green (C1–C2), cyan (C1–C3), and light green (C2–C3) (Supplementary Methods). The gray lines trace molecules of high FRET-efficiency with a bleaching A. For comparison, the FRET-efficiencies of the X-ray structures for an open (blue, PDB ID: 172L) and closed (violet, 148L) state (determined by FPS) are shown as horizontal lines in the FRET-efficiency histograms (magenta) in the left 1D projection; for S44pAcF/R119C E(open) = 0.40 and E(closed) = 0.54 and for Q69pAcF/P86C E(open) = 0.87 and E(closed) = 0.86. Black dashed lines mark the center of the main peak.

