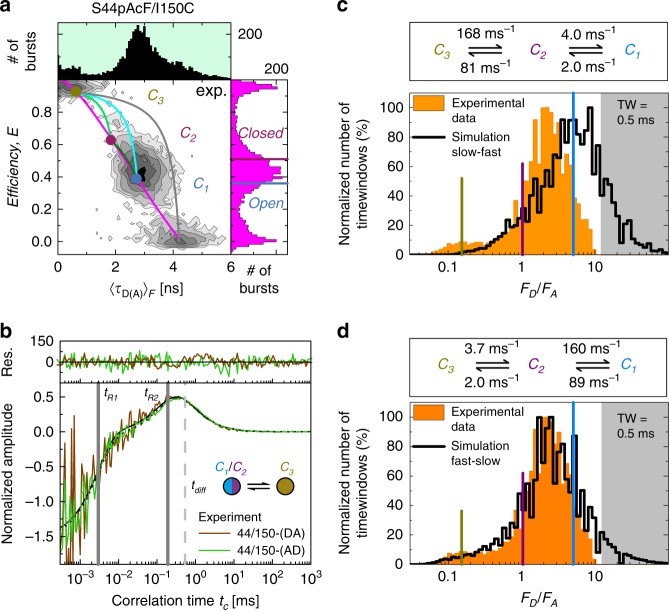
Fig. 3. Kinetic connectivity.
a The FRET-efficiency, E, and fluorescence lifetime of D in the presence of A, 〈τD(A)〉F, of the DA-labeled T4L variant S44pAcF/I150C (or wt**) is shown in the two-dimensional MFD-histograms (center) with the one-dimensional projections of E (right) and 〈τD(A)〉F (top). The magenta line (static FRET-line) represents the molecules with a single conformation. The dynamic FRET-lines represent the molecules changing their conformational state under monitoring. The limiting states (circles) of the dynamic FRET-lines (C1, blue; C2, purple; C3, yellow) are identified by eTCSPC (see Fig. 4). The dynamic FRET-lines are shown in dark green (C1–C2), cyan (C1–C3), and light green (C2–C3) (Supplementary Methods). The gray line represents the trace molecules of high FRET-efficiency with a bleaching A. The FRET-efficiencies of X-ray structures for an open (blue, PDB ID: 172L) and closed (violet, 148L) state (determined by FPS) are shown for comparison and represented as horizontal lines in the FRET-efficiency histograms. b Overlay of the normalized sCCFs (Supplementary Methods Equation (17)) of S44pAcF/I150C-(DA) and S44pAcF/I150C-(AD). The global fit with other variants shows two relaxation times (tR1 = 4.0 ± 2.3 µs, tR2 = 230 ± 28 µs) and a diffusion time tdiff = 0.54 ms. c, d Overlay of time-window analysis, slow-fast in c and fast-slow in d, respectively. The shaded area in gray indicates the region of donor only. See Supplementary Note 3 for data on the model and the simulation.

