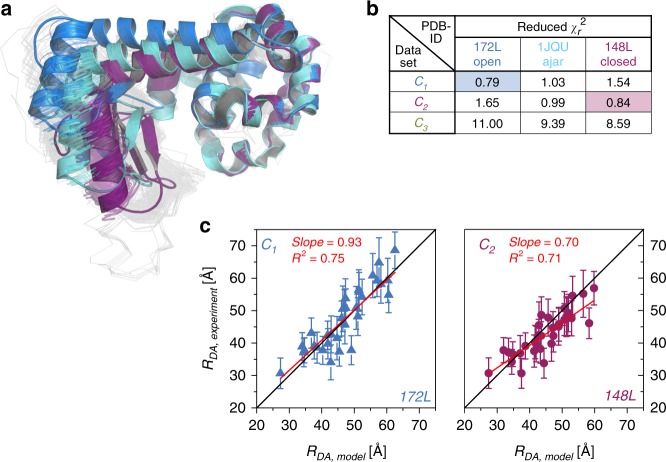
Fig. 5. PDB screening.
a Overlay of the PDB structures used for screening. Blue, light blue and violet cartoons show the cluster representative of the open (172L), ajar (1JQU), and closed (148L) conformation of T4L. b Reduced χ2r for each distance set compared to the expected distances from the selected cluster representative. c The experimental distances RDA,experimental of the C1 and C2 dataset are plotted against the model distances RDA,Model from the best PDB structure representative and fitted linearly (red lines). The black lines show a 1:1-relationship. Error bars shown are determined from the support plane analysis (95% confidence interval) shown in Fig. 4 and described in the text.

