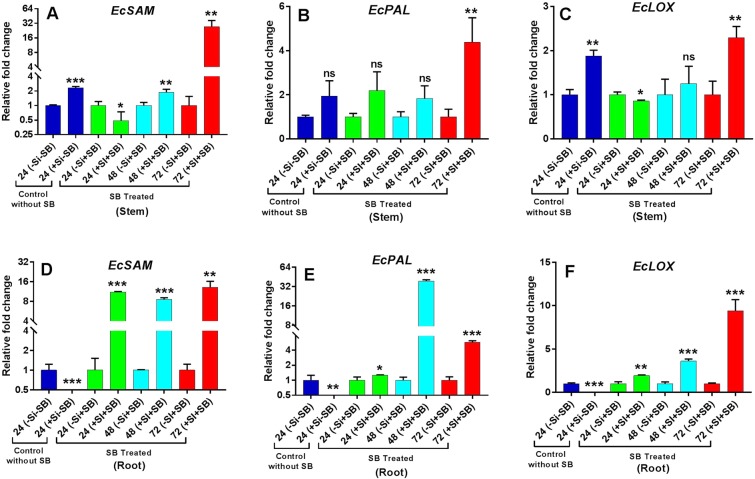
Figure 5.
Expression of representative genes (EcSAM, EcPAL and EcLOX) with (–Si–SB) control without Si and SB, and (–Si + SB) without silicon and with stem borer treatments at mentioned time points (24, 48 and 72 hpi) is considered as 1 fold after normalizing data with housekeeping gene (EcActin). The expression of genes in (+Si–SB) control with Si without SB, (+Si + SB) with silicon and stem borer is calculated as fold change. The fold change level of EcSAM, EcPAL and EcLOX are presented in fig (A–C) in stem and (D–F) in root of finger millet respectively. Error bars represents ± SD (n = 3). The star above the bars graph represents different level significance obtained from paired t-test (*) at 0.05, (**) at 0.01 and (***) at 0.001 alpha levels respectively.

