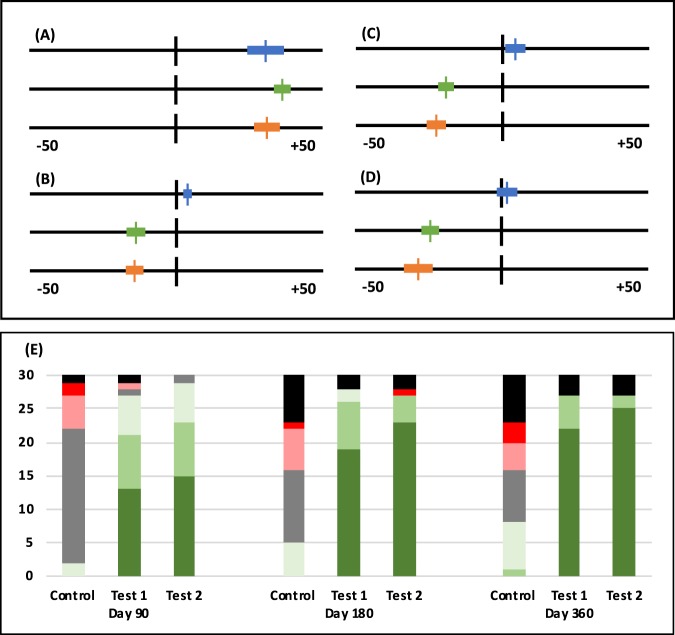
Figure 1.
Investigator Assessments of the study patients. (A–D) Visual Analogue Scale for Tactile Assessment. The lines indicate the 10-cm VAS scale ranging from −50 to +50. Negative values indicate a harder and smoother surface, and positive values indicate softer and rougher surface. Top Control Group (blue), middle Test Group 1 (green), bottom Test Group 2 (orange). The mean value is indicated by a vertical line, and the bars indicate the 95% Confidence Interval. (A) Baseline; (B) Day 90; (C) Day 180; (D) Day 360. (E) Bar chart representing the number of answers to the Global Impression of Change questionnaire for Control, Test Group 1 and Test Group 2 on the indicated follow-ups for each answer. The answers are colour coded: Worse (red); A little worse (light red); Unchanged (grey); A little better (light green); Better (green); Very much better (dark green); Missing answers (black).

