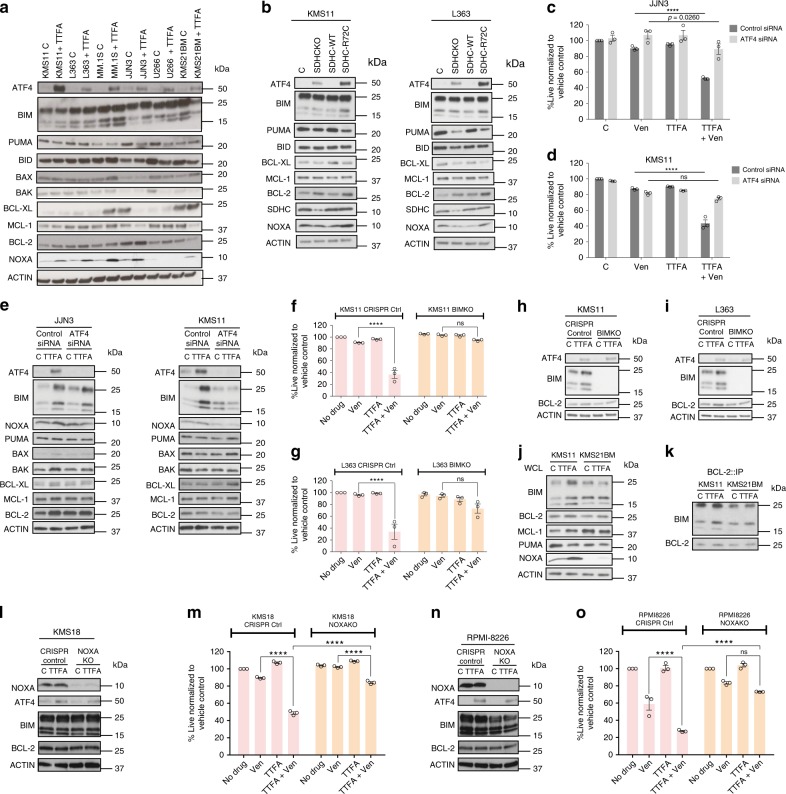
Fig. 5. ATF4, BIM and NOXA regulate TTFA-induced venetoclax sensitivity in MM.
a Expression of ATF4 and the indicated pro- and antiapoptotic proteins was evaluated in whole cell lysates of the indicated lines treated with ±100 μM TTFA for 24 h with Actin as loading control. Representative blots from one of three independent experiments is presented. b Protein expression levels were evaluated in SDHC-WT or SDHC-R72C mutant-expressing cells. c, d Control siRNA or ATF4 siRNA-transfected KMS11 or JJN3 cells were treated with venetoclax (0.5 μM), TTFA (100 μM) or the combination for 24 h and cell viability assessed by AnnexinV/DAPI flow cytometric staining. n = 3 independent experiments. Data are presented as mean values ± SEM. e Cells from (c, d) were used to prepare lysates for immunoblot evaluation of indicated proteins. f, g CRISPR Cas9 generated L363 and KMS11 BIMKO (KO efficiency shown in (h) and (i)) were treated with ±TTFA (100 μM), ±venetoclax (0.5 μM) for 24 h and cell death evaluated by Annexin V/DAPI flow cytometric staining. n = 3 independent experiments. Data are presented as mean values ± SEM. j Whole-cell lysates from KMS11 and KMS21BM treated or untreated with TTFA were evaluated for expression of indicated proteins by immunoblot analysis. k Cellular lysates from panel (j) were evaluated for immunoprecipitates of BCL-2 and bound BIM by immunoblotting. Representative blots from one of the three independent experiments is presented. l, n Whole-cell lysates from RPMI-8226 and KMS18 NOXA KO cells treated or untreated with TTFA were evaluated for expression of indicated proteins by immunoblot analysis. Representative blots from one of three independent experiments is presented. m, o RPMI-8226 and KMS18 NOXA KO cells were treated with ±TTFA (100 μM), ±venetoclax (0.5 μM) for 24 h and cell death evaluated by Annexin V/DAPI flow cytometric staining. n = 3 independent experiments. Data are presented as mean values ± SEM. Adjusted p values are calculated using a two-way ANOVA with post-hoc Tukey’s multiple comparisons test. **** denotes p value < 0.0001. Source data are provided as a source data file.

