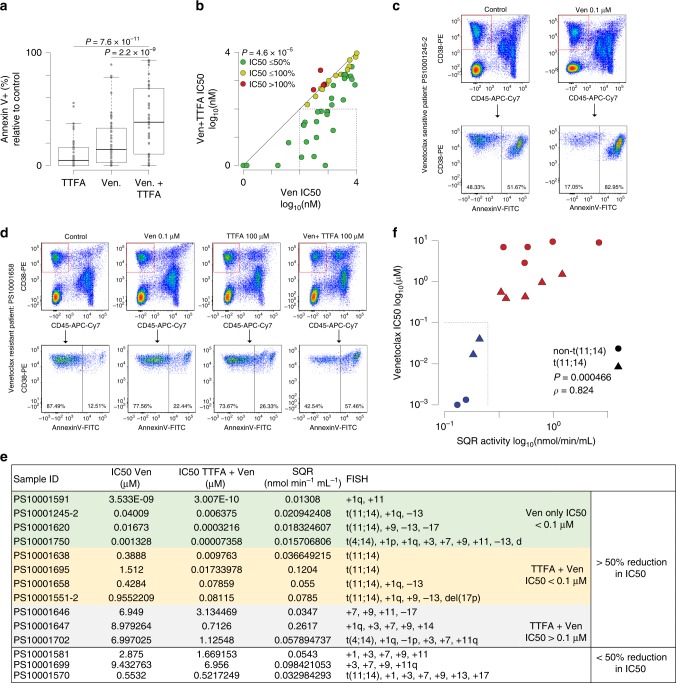
Fig. 6. SQR activity inversely correlates with venetoclax sensitivity in MM patient samples.
a Box plot of cell death measured by Annexin V staining relative to vehicle control in samples from 50 myeloma patient bone marrow aspirates treated with 0.1 μM venetoclax, 100 μM TTFA alone or in the combination for 24 h. CD38-PE and CD45-APC-Cy7 were used to gate myeloma cells. n = 50 biological independent samples. Boxplots show the median and quartiles with the whiskers extending to the most extreme data point within 1.5 times the interquartile range. IC50 ± TTFA was calculated as indicated in supplementary Table 1. b Scatter plot of IC50 for patient samples treated with venetoclax (Ven; x-axis) vs. those treated with Ven and 100 µM TTFA (y-axis). A diagonal line denotes one-to-one correspondence of IC50. Samples are colored by the change in IC50 relative to the Ven group (green: ≤50%; yellow: 50−100%; red >100%). The dashed box denotes patient samples with Ven IC50s > 100 nM and Ven + TTFA IC50s ≤ 100 nM. Samples with an IC50 < 1 nM are plotted at 1 nM. p values were calculated using a paired Student’s t test. c, d Flow plots of representative patient samples (exhibiting high and low SQR activity) and corresponding sensitivity of MM-gated cells to venetoclax and/or TTFA cotreatment are shown. e Ven ± TTFA IC50, SQR activity and FISH characteristics of purified CD138+ myeloma cells from 14 patient samples. Samples additionally segregated on the basis of >50% reduction in IC50. f Scatter plot of SQR activity and Venetoclax IC50 showing a positive correlation (Spearman’s rank correlation (ρ) = 0.824, n = 14, p value = 0.000466). Samples are colored by Ven IC50 (blue: ≤0.1 µM; red: >0.1 µM). Triangles denote t(11;14) samples and circles denote non-t(11;14) samples. The dashed box denotes patient samples with Ven IC50 ≤ 0.1 µM and SQR activity ≤ 0.25 nmol min−1 mL−1. Source data are provided as a source data file.

