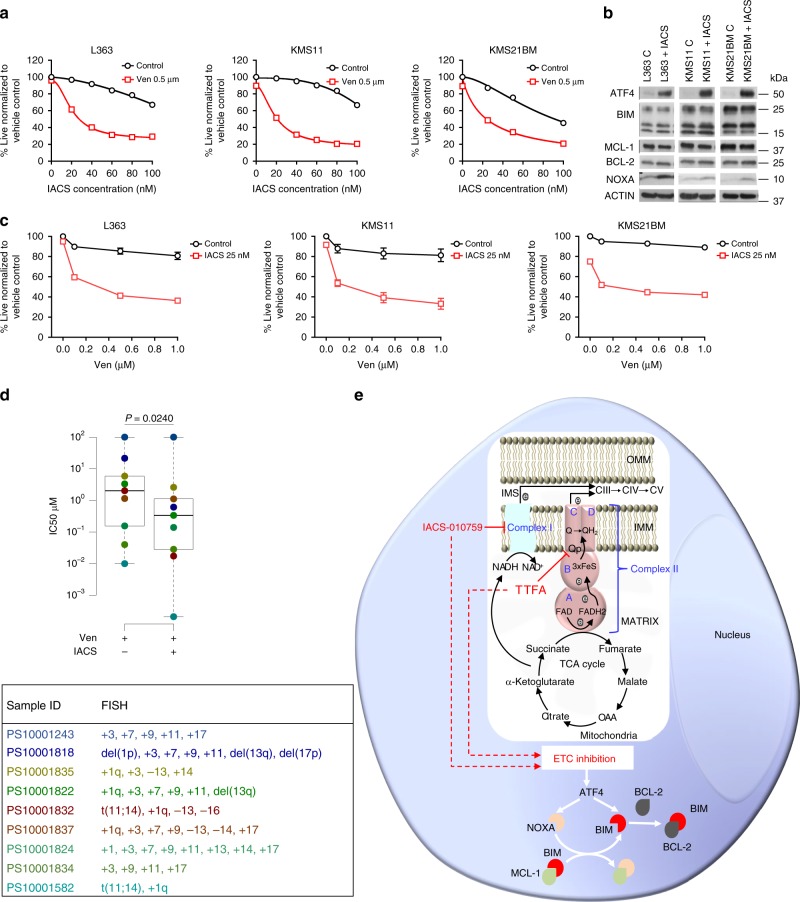
Fig. 7. Inhibition of Complex I with IACS-010759 sensitizes resistant MM to venetoclax.
a Dose−response curves for cotreatment of indicated cell lines with 0.5 µM venetoclax and increasing doses of IACS-010759 for 24 h. Cell viability assessed by AnnexinV/DAPI flow cytometric staining. b Expression of ATF4 and the indicated pro- and antiapoptotic proteins were evaluated in whole-cell lysates of the indicated lines treated ±25 nM IACS-010759 for 24 h. Actin was assessed as a loading control. Representative blots from one of two independent experiments is presented. c Dose−response curves for cotreatment of 25 nM IACS-010759 with increasing doses of venetoclax. Cell viability assessed by AnnexinV/DAPI staining. n = 3 independent experiments. Data are presented as mean values ± SEM. d Box plot of IC50 values of Ven and Ven + IACS, and table with FISH characteristics of nine myeloma patient samples. n = 9 biologically independent samples. Boxplots show the median and quartiles with the whiskers extending to the most extreme data point within 1.5 times the interquartile range. PS10001243 was resistant to Ven ± IACS and has been represented to have an artificial IC50 of 100 µM for Ven ± IACS in the box plot. e Mechanistic representation of how Complex I and Complex II regulate BCL-2 dependence in an MM cell. IACS-010759 and TTFA inhibit Complex I and Complex II, respectively, resulting in ETC inhibition. ETC inhibition regulates BCL-2 dependency by inducing ATF4. ATF4 induces NOXA (light orange) that displaces BIM (red) from MCL-1 (green). The increased binding of BIM to BCL-2 (gray) elevates BCL-2 dependence leading to sensitization to venetoclax. Source data are provided as a source data file.

