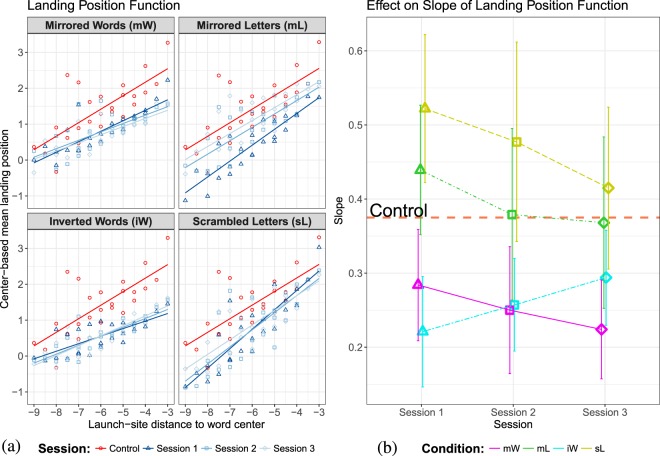
Figure 4.
Analysis of the launch-site effect on the systematic error component. (a) Landing position function: Mean center-based landing position as a function of center-based launch-site distance across all sessions. Red lines and dots represent data from normal reading session. Data from the first experimental sessions are presented in dark blue color. The lighter blue hues represent the last two experimental sessions. (b) The estimated slope parameter (and the 95% confidence interval) over the course of training in the experimental conditions. The red horizontal dashed line represents the estimated slope for reading normal text (baseline). Results for reading mirrored words (mW) and inverted words (iW) are presented with magenta and cyan lines, resp. Green and yellow lines represent estimations for reading texts with mirrored letters (mL) and scrambled letters (sL).

