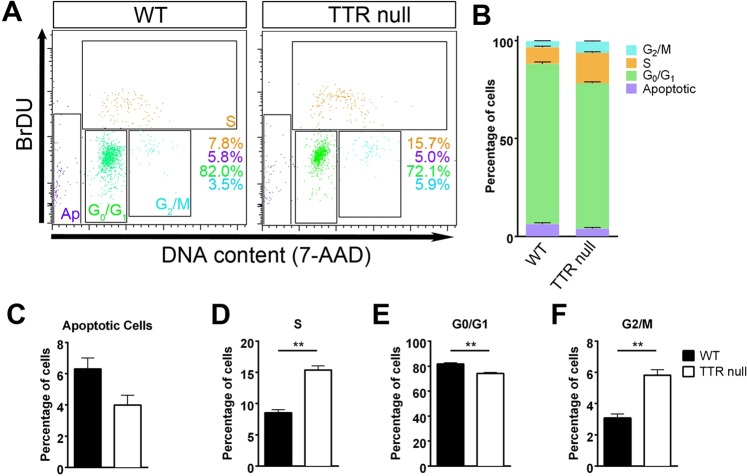
Figure 5.
Increased numbers of proliferating OPCs isolated from cortices of P7 TTR null compared to P7 wild type mice. (A–F) Flow cytometric analyses of BrdU-mediated cell cycle for OPCs isolated from P7 TTR null and wild type (WT) mice. (A) Representative dot plots following BrdU incorporation (Ap: apoptotic cells). (B) Percentage of OPCs in each stage of the cell cycle. (C) There was no significant difference in the number of apoptotic cells in OPCs from TTR null versus wild type mice (P = 0.0711). (D) There was a major increase in the population of OPCs in the S phase from TTR null mice (15%) compared to wild type mice (7%) (P = 0.0011). (E) There was a significant decrease in the population of OPCs cells in G0/G1 phase for OPCs isolated from cortices of TTR null mice (77%) versus wild type mice (84%) (P = 0.0031). (F) There was a substantial increase in the population of OPCs in G2/M phase in TTR null OPCs (6%) versus 4% in wild type mouse OPCs (P = 0.0034). All data were expressed as the mean ± SEM. Statistical comparisons were performed using Student’s t-test (n = 3, **P < 0.01, P < 0.05 was considered statistically significant)30.

