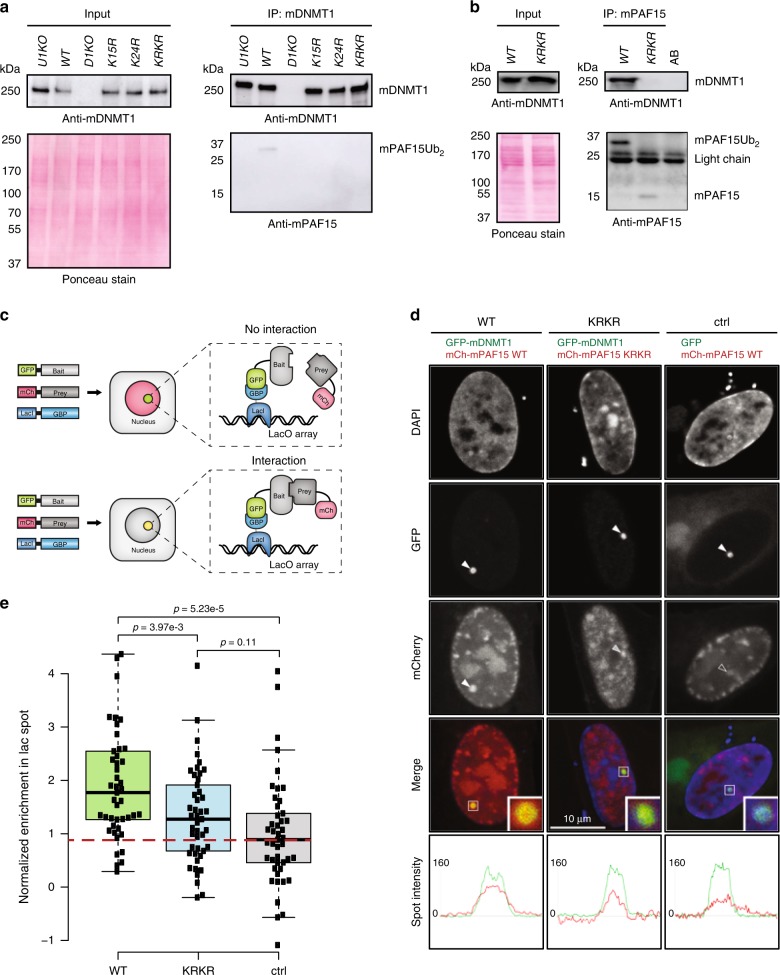
Fig. 5. Dual mono-ubiquitylation of mPAF15 is required for the mPAF15–mDNMT1 interaction in mouse ESCs.
a Immunoprecipitation of endogenous DNMT1 from whole-cell lysates of wild-type J1 (WT), Dnmt1 KO (D1KO), Uhrf1 KO (U1KO), Paf15 K15R (K15R), Paf15 K24R (K24R), and Paf15 K15/24R (KRKR) mESCs using an anti-mDNMT1 nanobody. Bound fractions were subjected to immunoblotting with anti-mDNMT1 and anti-mPAF15 antibodies. The anti-mDNMT1 blot and Ponceau staining are shown as loading controls. b Immunoprecipitation of endogenous mPAF15 from WT and KRKR mESC nuclear extracts using an anti-mPAF15 antibody. Bound fractions were subjected to immunoblotting with anti-mDNMT1 and anti-mPAF15 antibodies. The anti-mDNMT1 blot and Ponceau staining are shown as loading controls. c Schematic of the fluorescent-3-hybrid (F3H) assay for the in vivo determination of protein–protein interactions. GFP-tagged bait protein is immobilized at an array of Lac operator (LacO) sequences by a GFP-binding protein (GBP) coupled to the lac repressor (LacI). When the GFP-tagged bait protein does not interact with the prey protein, only a GFP signal is visible at the LacO locus, whereas a yellow spot (combination of GFP and mCherry signal) is visible at the LacO locus in the case of a positive interaction. d, e F3H assay for a BHK cell-based analysis of ubiquitylation-mediated recruitment of mPAF15 to mDNMT1. d Cells containing a stably integrated lacO array were transfected with the GBP-LacI, a GFP-tagged bait (GFP-mDNMT1 or GFP), and an mCherry-tagged prey (mCherry-mPAF15 wild-type (WT) or mCherry-mPAF15 K15R/K24R double mutant (KRKR)). Line intensity profiles for GFP and mCherry in the respective spots are shown below the confocal images. Scale bar, 10 μm. e Quantification of the F3H assay. Background subtracted mCherry/GFP ratios within the spots were normalized to the control and plotted with n = 45 from 3 independent replicates (per replicate, n = 15). In the boxplots, horizontal black lines within boxes represent median values, boxes indicate the upper and lower quartiles, and whiskers indicate the 1.5× interquartile range. Statistical significance was determined using Student’s t test. Source data are provided as a Source Data file.

