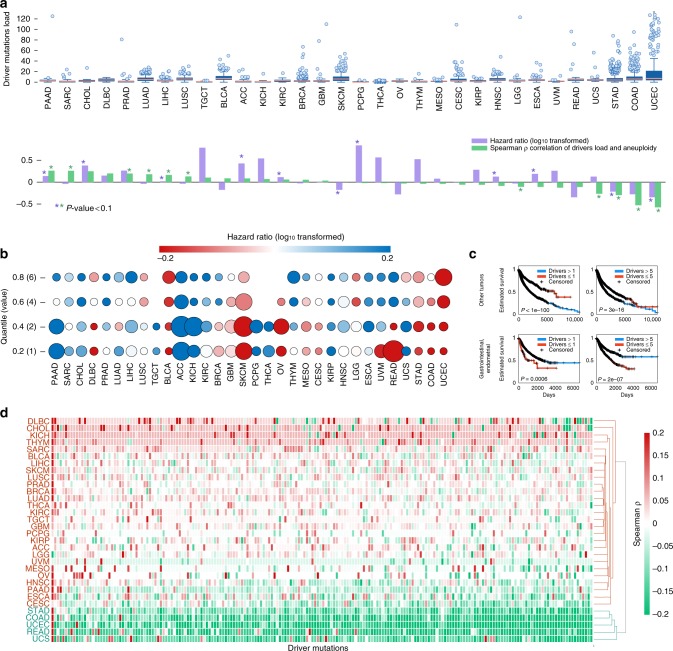
Fig. 1. Pan-cancer association between the number of driver mutations, levels of aneuploidy and overall survival.
a Top panel: Boxplots showing the distribution of the number of driver mutations per sample in each tumor type. Center lines indicate medians, box edges represent the interquartile range, whiskers extend to the most extreme data points not considered outliers, and the outliers are plotted individually. Bottom panel: the corresponding correlation coefficients between the number of driver mutations and aneuploidy scores, and the hazard ratio values (log10 transformed) resulting from Kaplan–Meier overall survival curves for samples with high vs. low number of driver mutations (separated by the median). Positive log10-hazard ratio values indicate that high load of driver mutations is associated with worse survival, and negative log10-hazard ratio values indicate that high load of drivers is associated with improved survival. Statistical significance (log-rank and Spearman rank-correlation P-value < 0.05) is indicated with asterisk. b The hazard ratio values resulting from Kaplan–Meier overall survival prediction curves for samples with high vs. low number of driver mutations for different thresholds (y-axis), for different tumor types (x-axis). The circle sizes represent the significance level measured as log-rank P-value. c Kaplan–Meier curves predicting overall survival for gastrointestinal and endometrial tumors (bottom panels) and for all other tumors (top panels), for tumors with high vs. low number of cancer driver mutations separated with two thresholds. The log-rank P-values are indicated. d tumor clustering based on the associations between aneuploidy and driver mutations (columns) for each tumor type (rows). Source data are provided as a Source Data file.

