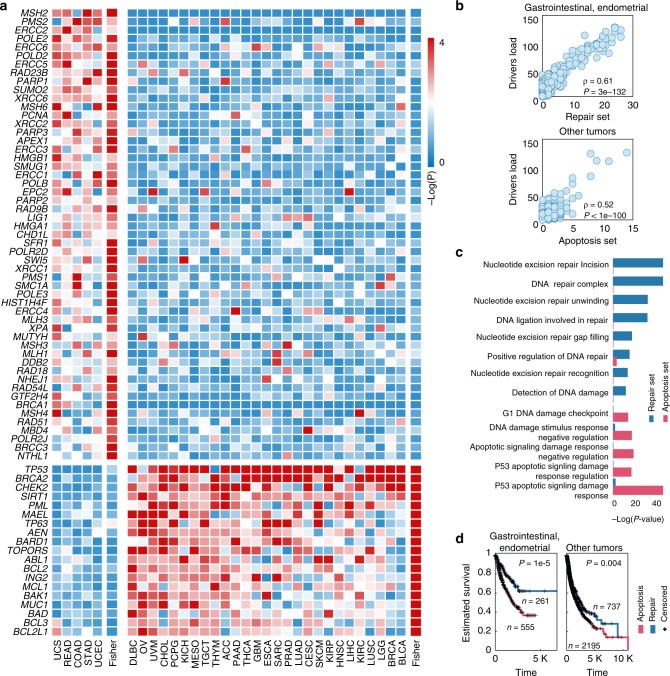
Fig. 2. Driver-associated mutation sets distinguish DNA repair from damage-induced apoptosis.
a Heatmaps showing selection P-values (negative log-scaled) assigned to each gene in the selected mutational sets (rows) for every tumor type and the combined P-values for each cluster of tumors (columns). b scatter plots correlating the driver mutation load (y-axes) with the repair set load (upper panel x-axis, for gastrointestinal and endometrial tumors), and with the apoptosis set load (bottom panel x-axis, for all other tumor types). c hyper-geometric enrichment P-value for the DDR pathways enriched with genes from one of the selected sets. d Kaplan–Meier curves predicting overall survival for patients with higher repair set mutation rate (i.e. more repair set mutations than apoptosis set mutations, blue) vs. those with higher apoptosis set mutation rate (red), for gastrointestinal and endometrial tumor samples (left panel) and all other tumor samples (right panel).

