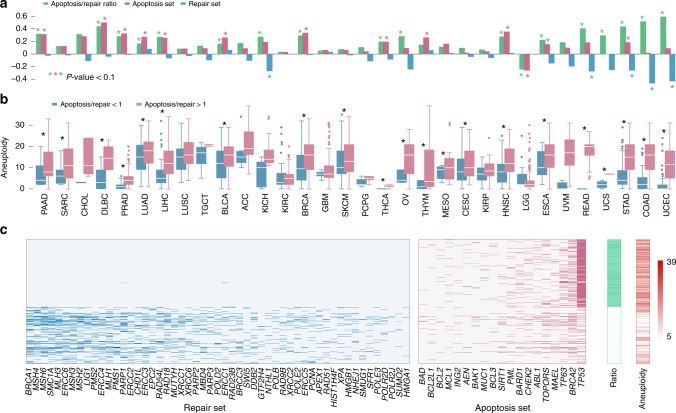
Fig. 3. DNA repair and apoptosis mutational sets correlate with aneuploidy.
a Spearman correlation coefficients between aneuploidy and the apoptosis and repair set load, and their ratio. Statistical significance (Spearman rank-correlation P-value < 0.05) is indicated with asterisk. b Boxplot comparing the aneuploidy distribution between low (<1) and high (>1) apoptosis to repair set load ratio. Statistical significance (Rank-sum P-value < 0.05) is indicated with asterisk. Center lines indicate medians, box edges represent the interquartile range, whiskers extend to the most extreme data points not considered outliers, and the outliers are plotted individually. c Map of the repair and apoptosis set mutations and levels of aneuploidy, for samples with highest and lowest apoptosis to repair set load ratios (top and bottom 0.05 quartiles).

