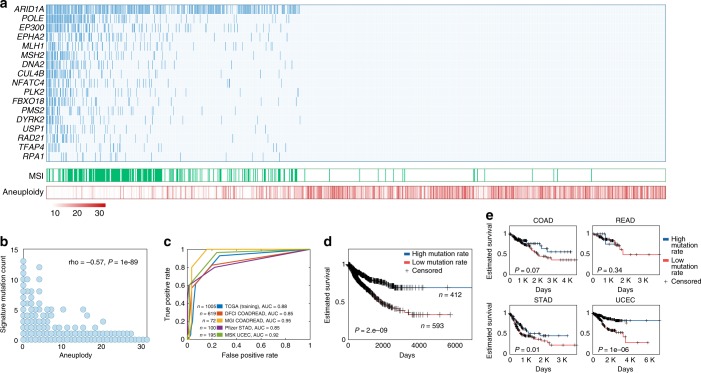
Fig. 4. Mutated gene set reflecting the tradeoff between MSI and aneuploidy.
a The mutations in the selected set (top panel) positively correlate with MSI (middle panel) and negatively correlate with aneuploidy (bottom panel) across gastrointestinal and endometrial tumor samples (b) correlation between aneuploidy (x-axis) and the aneuploidy-MSI set mutation load (y-axis). c ROC classification curves predicting MSI using the aneuploidy-MSI set mutation load in the training data and four test datasets. d Kaplan–Meier curves predicting overall survival across gastrointestinal and endometrial tumor samples with high vs. low number of aneuploidy-MSI set mutations, separated by the median. e Kaplan-Meier curves predicting overall survival in each colon (COAD), rectal (READ), stomach (STAD), uterine corpus (UCEC), and uterine (UCS) carcinomas, for samples with high vs. low number of aneuploidy-MSI set mutations separated by the median. The log-rank P-value are provided.

