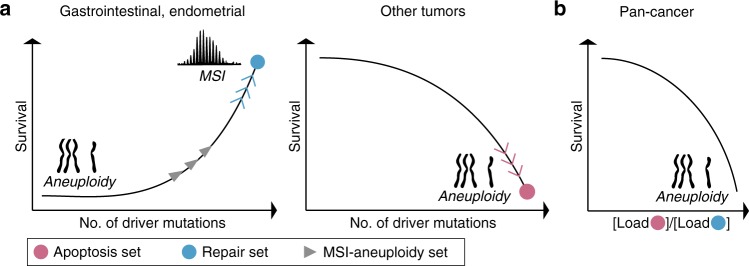
Fig. 6. A schematic, conceptual depiction of the emerging links between patient survival, driver mutation load and aneuploidy in the two tumor classes.
a Driver mutations, aneuploidy, patient survival, and mutation sets in the two tumor classes. The mutation sets derived to predict high driver mutations load are shown by circles. The inverse relationship between aneuploidy and MSI is demonstrated for the gastrointestinal and endometrial scheme, with the derived MSI-aneuploidy set. b The ratio of the mutation loads in the apoptosis vs repair sets as universal predictor of patient survival.

