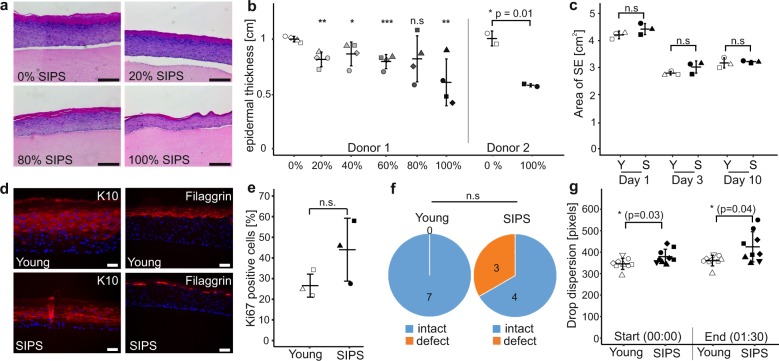
Fig. 2. Senescent fibroblasts induce hallmarks of skin aging in a 3D model.
a, b Reduction of epidermal thickness in senoskin equivalents. Senoskin equivalents were built by gradually replacing proliferating with senescent fibroblasts. a Representative H&E sections of Donor 1 are shown. Scale bar 200 µm. b For each sample, relative thickness of the whole skin-equivalent section (5–7 images each) was measured using ImageJ, and mean thickness was calculated. On the left side of the graph, four independent replicates were counted for each condition in a blinded fashion; on the right side, the experiment was repeated twice in a second fibroblast donor. Statistical analysis was performed for Donor 1 using ANOVA and Dunnett post hoc test against control (0% SIPS). For Donor 2, unpaired t test was used. Error bars indicate SD. n.s ≥ 0.05; *p < 0.05; **p < 0.01. c Contractibility of the dermis is not affected by the addition of senescent fibroblasts. SEs were built either with proliferating (Young) or senescent fibroblasts (SIPS). Pictures of the SEs were taken daily, and contraction of the dermis was evaluated by measuring the total area via ImageJ. Three independent replicates from one donor are shown. Statistical analysis was performed using unpaired t test; error bars indicate SD. n.s ≥ 0.05; *p < 0.05; **p < 0.01. d Evaluation of differentiation markers in senoskin equivalents. SEs were prepared according to the protocol and analyzed for the early differentiation marker Cytokeratin 10 (d, left) and late differentiation marker Filaggrin (d, right). Representative images of one experiment are shown. Scale bar 50 µm. e Evaluation of the proliferation marker Ki67 in senoskin equivalents. SEs were prepared according to the protocol, and Ki67-positive cells were counted in three independent replicates in a blinded fashion. Percentage versus total cells in the stratum basale are given. Statistical analysis was performed using unpaired t test; error bars indicate SD. n.s ≥ 0.05; *p < 0.05; **p < 0.01. f Integrity of barrier function. SEs were prepared according to the protocol and analyzed for barrier integrity by adding a drop of biotin on top of the sample for 1 h (37 °C, 7% CO2). The SEs were then embedded in paraffin, sectioned, and counterstained with a streptavidin-Alexa488 conjugate. Integrity of barrier function was evaluated in a blinded fashion, and converted into a yes/no statement. The results from seven independent replicates from one fibroblast donor are shown. Statistical analysis was performed using Fisher’s exact test, n.s ≥ 0.05. g Evaluation of surface properties using contact-angle measurement. Skin-equivalent biopsies (6 mm) were punched out and fixed on the contact- angle measurement stage. Via a syringe, 5 µl of water was added as a drop on top of the SE, and flow/leakage was recorded via camera for 1:30 min. Pictures at the start of the experiment (0:00 min) and at the end (1:30 min) were captured, and the area of the droplet was quantified via ImageJ. Nine independent replicates from one fibroblast donor are shown. Statistical analysis was performed using unpaired t test; error bars indicate SD. n.s ≥ 0.05; *p < 0.05; **p < 0.01.

