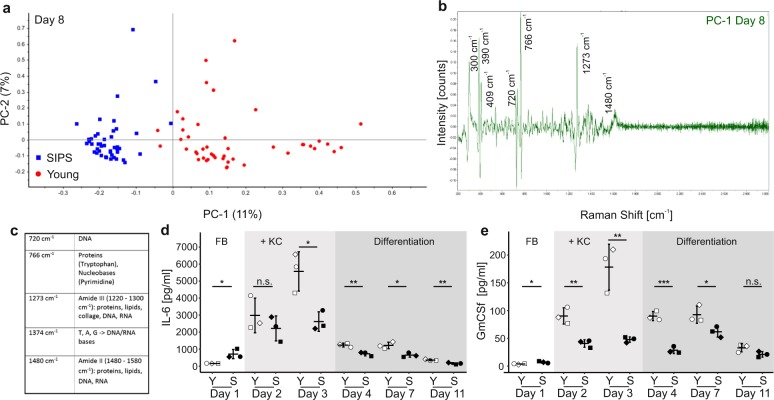
Fig. 3. Distinct changes in the chemical composition of senoskin supernatants.
a–c Raman microspectroscopy discriminates between supernatants from young and senoskin models. Raman spectra were enhanced using gold nanoparticles, which were dried overnight on a glass slide, before supernatants from young or senoskin equivalents (from day 8, differentiation phase) were added. Spectra were acquired with a 785-nm laser over a range of 400–3000 cm−1. A total of 15 spectra per sample were collected; three biological samples were measured per condition. The first derivative was calculated, and after unit vector normalization, spectra were subjected to principal component analysis (PCA, a). In b, the main differences in Raman spectra of supernatants from senoskins and young skin equivalents are visualized as peaks. Panel c gives an overview of the most prominent bands and their corresponding major components. d, e Cytokine pattern in supernatants of sensoskin equivalents. IL-6 (d) and GmCSF (e) levels were analyzed in supernatants from young and senoskin equivalents via ELISA. Samples were taken on days 1, 2, 3, 4, 7, and 11, whereas the first three time points reflect the growing phase of the experiment. Keratinocytes are added on day 2. On day 4, differentiation of KCs is induced via generation of an air–liquid interface. Per condition, three independent replicates from one donor are shown. Statistical analysis was performed using unpaired t test (Bonferroni corrected); error bars indicate SD. n.s ≥ 0.05; *p < 0.05; **p < 0.01.

