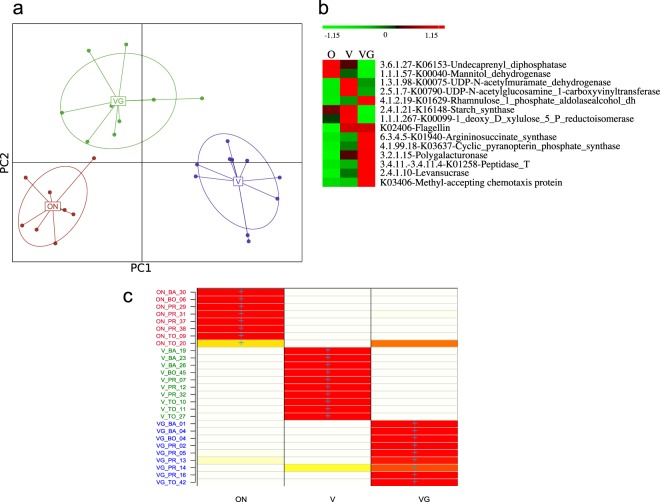
Figure 2.
Multivariate statistical analyses based on the meta-proteomes of omnivores (O), vegans (V) or vegetarians (VG). Panel a, discriminant analysis of principal components (DAPC) score plot. Panel b, heatmap showing the differentially (FDR < 0.05) detected proteins in the sample meta-proteomes that mostly discriminated the diet groups. The colors of the scale bar denote the protein abundance with 1.15 indicating the highest abundance (red) and −1.15 indicating the lowest abundance (green) between diet groups. Panel c represents whether the individuals (rows) were correctly assigned (based on discriminant functions) to the genetic cluster where they were included a priori (columns) by K-means analyses used to infer the best-supported clustering solution. Colors represent membership probabilities to each cluster (red = 1, orange = 0.75, yellow = 0.25, white = 0) and blue crosses indicate the cluster where the individuals were originally assigned by K-means analyses. Sample label colours match the sample diet labels in the DAPC clusters (Panel a).

