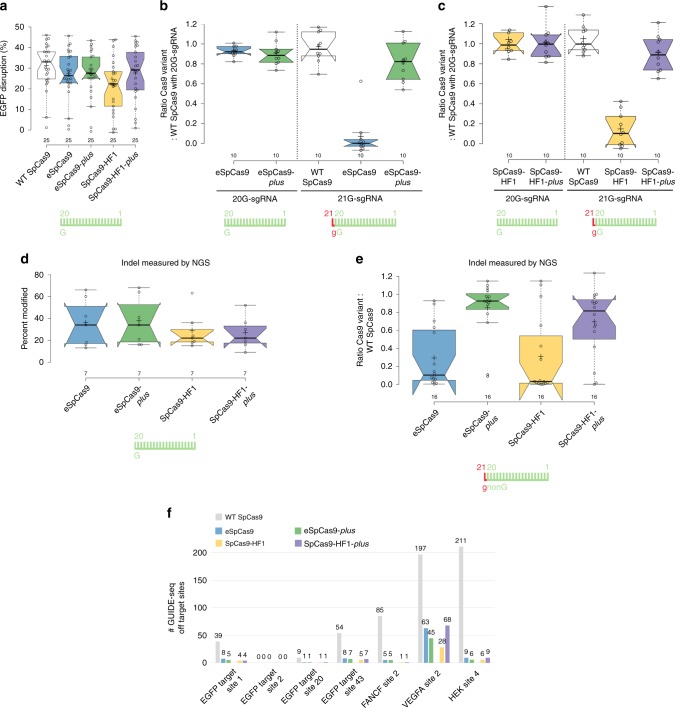
Fig. 5. eSpCas9-plus and SpCas9-HF1-plus show greatly enhanced on-target activity with 21G-sgRNAs and identical fidelity/target-selectivity compared to eSpCas9 and SpCas9-HF1, respectively, as assessed by EGFP disruption, indels measured by NGS and by GUIDE-seq.
a–c EGFP-disruption activity a with 20G-sgRNAs targeting 25 sites; b, c with either 20G- or 21G-sgRNA pairs targeting two alternative sets of 10 different sequences shown as the ratio of variant activity to WT activity. d, e On-target activities of SpCas9 variants across 23 endogenous target sites within the human VEGFA or FANCF loci targeted with d 20G- or e 21G-sgRNAs, measured by amplicon resequencing. f Bar chart of the total number of off-target sites detected by GUIDE-seq for SpCas9 variants on seven sites targeted with 20G-sgRNAs. a–e Tukey-type boxplots by BoxPlotR60: center lines show the medians; box limits indicate the 25th and 75th percentiles; whiskers extend to the “minimum” and “maximum” data situated within 1.5 times the interquartile range from the 25th and 75th percentiles, respectively; notches indicate the 95% confidence intervals for the medians; crosses represent sample means; data points are plotted as open circles representing the mean of biologically independent triplicates. Spacers are schematically depicted beside the charts as combs: green color teeth indicate matching-, while a red color tooth indicates the presence of an appended nucleotide within the spacer; numbering of tooth position corresponds to the distance of the nucleotide from the PAM; the starting 20th nucleotide of the spacer is indicated by an uppercase letter and an appended 21st nucleotide by a red lowercase letter. See also Supplementary Figs. 6 and 7.

