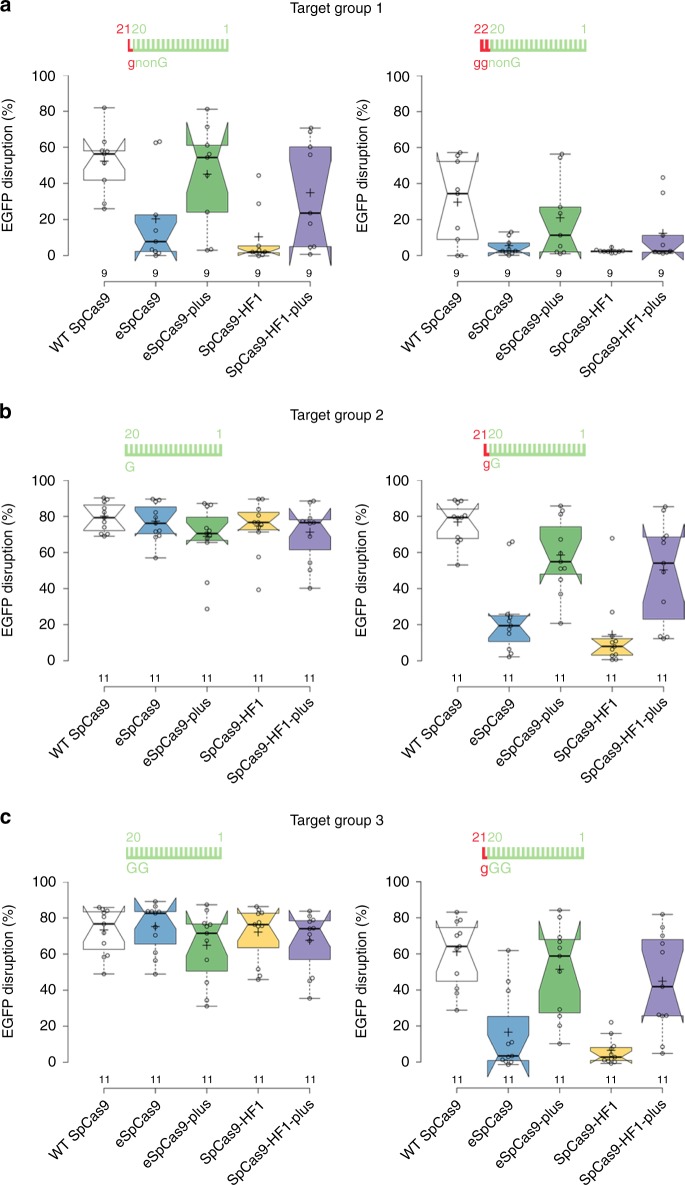
Fig. 6. The plus variants are effective when transfected in pre-assembled RNP form.
a–c EGFP-disruption assays. Target sequences start with 5′ non-G-, G- or GG-nucleotides. Data from the individual samples are detailed in Supplementary Fig. 8c–e. Tukey-type boxplots by BoxPlotR60: center lines show the medians; box limits indicate the 25th and 75th percentiles; whiskers extend to the “minimum” and “maximum” data situated within 1.5 times the interquartile range from the 25th and 75th percentiles, respectively; notches indicate the 95% confidence intervals for the medians; crosses represent sample means; data points are plotted as open circles representing the mean of biologically independent triplicates. Spacers are schematically depicted beside the charts as combs: green color teeth indicate matching-, while a red color tooth indicates the presence of an appended nucleotide within the spacer; numbering of tooth position corresponds to the distance of the nucleotide from the PAM; the starting 20th nucleotide or dinucleotide of the spacer is indicated by an uppercase letter and an appended 21st and 22nd nucleotides by red lowercase letters. See also Supplementary Fig. 8.

