Figure 1.

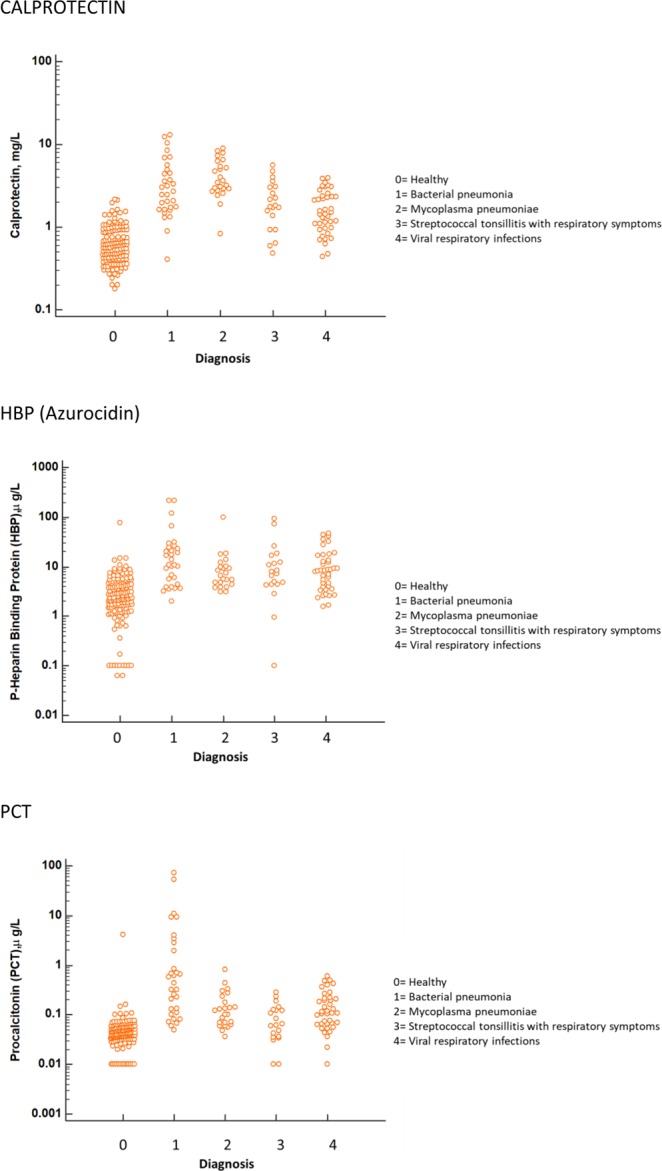
Biomarker concentrations in the different diagnostic groups, as indicated by the numbers. Top: Calprotectin, Middle: HBP (Azurocidin), Bottom: Procalcitonin. For all panels, only results with verified etiologies are presented.

Biomarker concentrations in the different diagnostic groups, as indicated by the numbers. Top: Calprotectin, Middle: HBP (Azurocidin), Bottom: Procalcitonin. For all panels, only results with verified etiologies are presented.