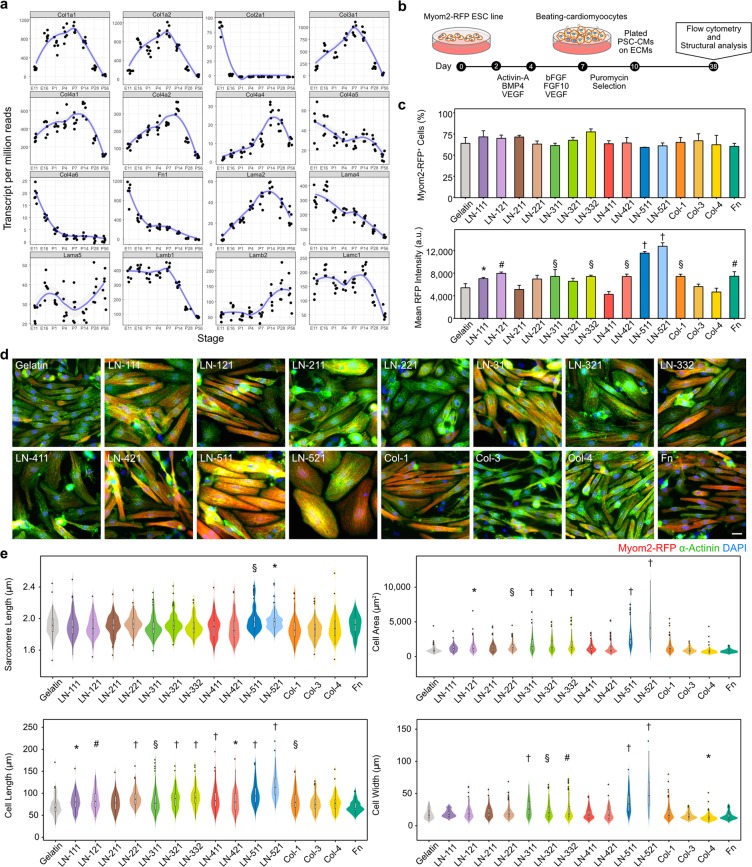
Figure 4.
ECMs increased RFP intensity and led to structural maturation. (a) Expression profiles of selected ECMs including laminin, collagen, and fibronectin during heart development (E11 to P56). (b) A schematic diagram of the experiment for quantification of Myom2-RFP expression and structural analysis after ECM treatments for 38 days of cardiac differentiation. (c) Effects of ECM treatments on fraction of RFP+ cardiomyocytes and RFP intensity. Data are presented as means ± SD (n = 3). Fluorescence intensities are presented as arbitrary unit (a.u.). Dunnett’s test was used to compare each ECM treatment with a control (gelatin); *P < 0.05, §P < 0.01, #P < 0.001, †P < 0.0001. (d) Representative images for ECM-treated cells stained with α-actinin antibody (green), TagRFP (red), and DAPI for nuclei (blue). Scale bar, 20 μm. (e) Statistics of structural and morphological features. Sarcomere length, cell area, cell length, and cell width were examined. To note, ECM-treated cells exhibited significant increase in sarcomere length, cell area, cell length, and cell width, especially with laminin (LN)-511/521 treatments, compared with controls. Violin plots are explained in Fig. 2. n > 100 from three different cardiac differentiation runs. Dunnett’s test was used to compare each ECM treatment with a control (gelatin); *P < 0.05, §P < 0.01, #P < 0.001, †P < 0.0001.

