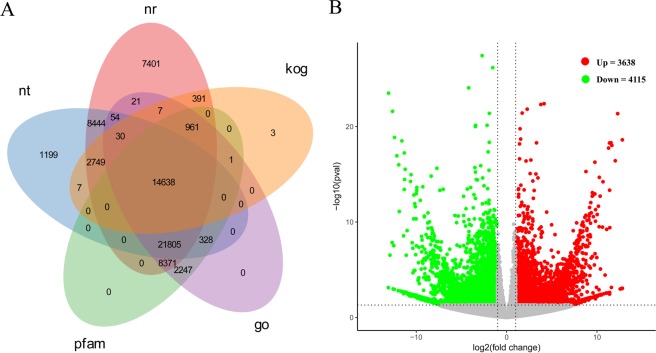
Figure 1.
(A) Venn diagram of functional annotations of unigenes in nt (NCBI non-redundant protein sequences), nr (NCBI non-redundant protein sequences), kog (Clusters of Orthologous Groups of proteins), go (Gene Ontology) and pfam (Protein family) databases. (B) Expression patterns of differentially expressed genes (DEGs) identified between 300 mM NaCl treated and control. Red and green dots represent DEGs, grey dots indicate genes that were not differentially expressed. In total, 7,753 unigenes were identified as DEGs (padj <0.05) between NaCl treated and control samples, including 3,638 upregulated genes and 4,115 downregulated genes.

