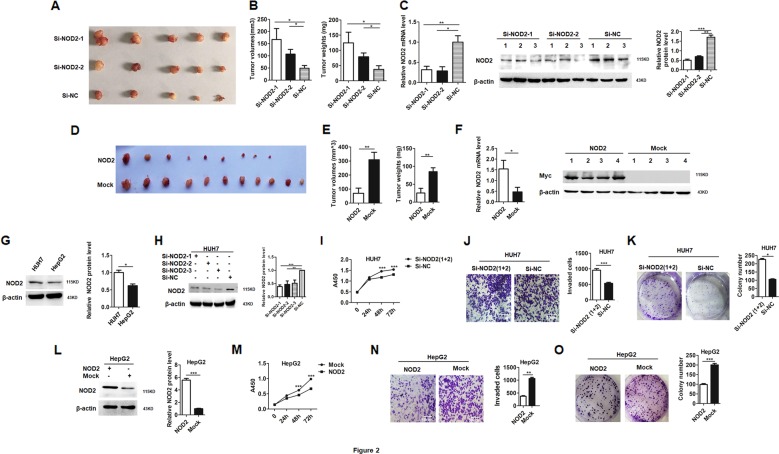
Fig. 2. NOD2 suppressed xenograft tumor growth and the malignant behaviors of HCC cells.
a 1 × 10⁷ HUH7 cells were subcutaneously injected to the right flanks of the nude mice (n = 15). When visible tumor appeared, the mice were randomly divided into three groups, and the investigator was blinded to the group allocation. Two groups of tumors (n = 5 for each group) were injected with two independent siRNAs against NOD2 (Si-NOD2), and the other group (n = 5) was injected with nonsense sequence (Si-NC) as a control. Images of the isolated tumors from the three experimental groups were presented. b Tumor volumes (left panel) and tumor weights (right panel) of these three groups of tumors were measured and statistically analyzed. c Relative NOD2 mRNA expression in these groups was detected by qRT-PCR (left panel). The relative NOD2 protein expression was detected by western blot (middle panel), and band intensities were statistically analyzed (right panel). d 1 × 10⁷ HUH7 cells were subcutaneously injected to both flanks of the nude mice (n = 11). When visible tumor appeared, the tumors in the left flanks were transfected with NOD2 plasmid while tumors in the right flanks were transfected with mock plasmid. Images of the tumors separated from both flanks of the nude mice were presented. e Tumor volumes and tumor weights of NOD2 and mock plasmid transfected groups were statistically analyzed and compared. f qRT-PCR (left panel) and western blot (right panel) were performed to detect the relative NOD2 expression level in NOD2 plasmid and mock plasmid transfected group. g The basal expression levels of NOD2 in two HCC cell lines were detected by western blot assay. h Three interference RNAs against NOD2 were synthesized and tested in HUH7 cells for their blocking efficiency. i HUH7 cells were transfected with the mixture of Si-NOD2-1 and Si-NOD2-2, and the proliferation of HCC cells was detected at 0 h, 24 h, 48 h and 72 h. j, k HUH7 cells were transfected with the mixture of Si-NOD2-1 and Si-NOD2-2, and the invasion (j) and colony formation capabilities (k) of these transfected cells were detected and compared. l–o HepG2 cells were transfected with NOD2 plasmid or mock plasmid, western blot was performed to verify the successful overexpression of NOD2 (l). The proliferation of HCC cells was detected at 0 h, 24 h, 48 h and 72 h after the transfection (m). Invasion (n) and colony formation capabilities (o) of these transfected cells were detected and statistically analyzed. *P < 0.05, **P < 0.01, ***P < 0.001 for statistical analysis of the indicated groups. Presented figures are representative data from three independent experiments.

