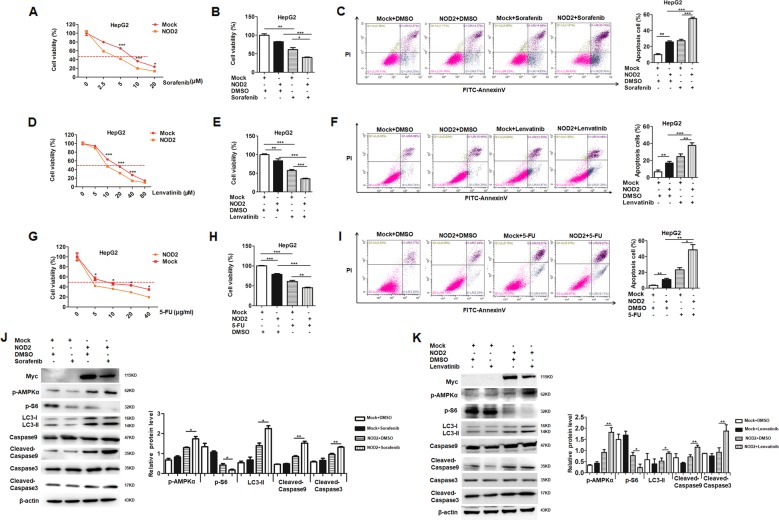
Fig. 5. NOD2 significantly enhanced the chemosensitivity of HCC cells to sorafenib, lenvatinib and 5-FU.
a HepG2 cells were plated in 96-well plate at the density of 1 × 10⁴ cells/well. After being cultured overnight, the cells were transfected with Myc-NOD2 plasmid or mock control plasmid. The transfected cells were further treated with different dosages (0 μM, 2.5 μM, 5 μM, 10 μM, and 20 μM) of sorafenib. 48 h after the treatment, CCK-8 assay was used to detect the cell viability. b HepG2 cells were plated in 96-well plate before being transfected with Myc-NOD2 or mock control. HCC cells were treated with sorafenib (5 μM), and the cells treated with the same volume of DMSO acted as a vehicle control. Cell viabilities were detected by CCK-8 assay after the cells were treated with sorafenib for 48 h. c HepG2 cells were plated in 6-well plate before transfected with NOD2 plasmid or mock control plasmid. HCC cells were treated with sorafenib (5 μM), and the cells treated with the same volume of DMSO acted as a control group. Annexin V/PI staining was used to detect cell apoptosis after the treatment with sorafenib for 48 h. d HepG2 cells were plated in 96-well plate at the density of 1 × 10⁴ cells/well. After being cultured overnight, the cells were transfected with Myc-NOD2 plasmid or mock control plasmid. The transfected cells were further treated with different dosages (0 μM, 5 μM, 10 μM, 20 μM, 40 μM, and 80 μM) of lenvatinib. 48 h after the treatment, CCK-8 assay was used to detect the cell viability. e HepG2 cells were plated in 96-well plate before being transfected with Myc-NOD2 plasmid or mock control plasmid. HCC cells were treated with lenvatinib (10 μM), and the cells treated with the same volume of DMSO acted as a vehicle control. Cell viabilities were detected by CCK-8 assay after the cells were treated with lenvatinib for 48 h. f HepG2 cells were plated in 6-well plate before being transfected with NOD2 plasmid or mock control plasmid. HCC cells were treated with lenvatinib (10 μM), and the cells treated with the same volume of DMSO acted as a control group. Annexin V/PI staining was used to detect cell apoptosis after the treatment with lenvatinib for 48 h. g HepG2 cells were plated in 96-well plate at the density of 1 × 10⁴ cells/well. After being cultured overnight, the cells were transfected with Myc-NOD2 plasmid or mock control plasmid. The cells were further treated with different dosages (0 μg/ml, 5 μg/ml, 10 μg/ml, 20 μg/ml and 40 μg/ml) of 5-FU. 48 h after the treatment, CCK-8 assay was performed to detect the cell viabilities. h HepG2 cells were plated in the 96-well plate before being transfected with NOD2 plasmid or mock control plasmid. HCC cells were treated with 5-FU (10 μg/ml) for 48 h before CCK-8 assay was performed to detect the cell viabilities. i HepG2 cells were plated in 6-well plate before being transfected with NOD2 plasmid or mock control plasmid. The transfected cells were treated with 5-FU (10 μg/ml) for 48 h before apoptosis was analyzed by Annexin V/PI staining. j, k HepG2 cells were transfected with Myc-NOD2 plasmid or mock control plasmid, followed by further treatment with sorafenib (5 μM) or lenvatinib (10 μM) for 48 h. Western blot assay was performed to detect the activation of AMPK pathway and mTORC1 pathway. Apoptosis and autophagy related markers of the sorafenib (j) or lenvatinib (k) treated HCC cells were also detected by western blot. *P < 0.05, **P < 0.01, ***P < 0.001 for statistical analysis of the indicated groups. Presented figures are representative data from three independent experiments.

