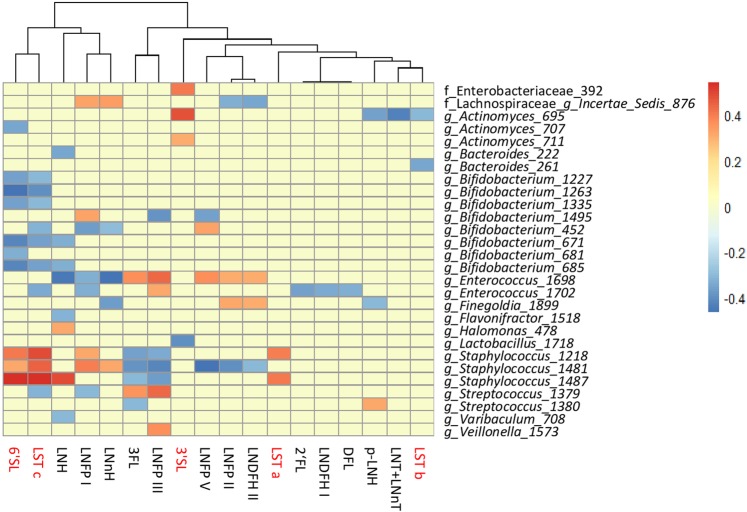
Figure 3.
Statistically significant (p < 0.05) Spearman correlations (correlation threshold ±0.3) between estimated daily intake of different milk HMOs and faecal microbiota composition at OTU level of 24 infants across the study duration. Positive associations are indicated in red, negative in blue, and correlations that did not pass significance or correlation threshold are marked in yellow. The names of acidic HMOs are highlighted in red.

