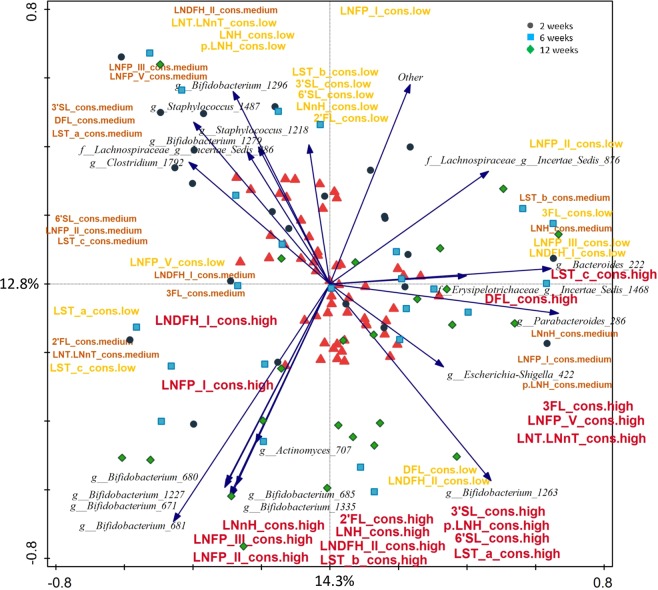
Figure 6.
RDA showing spatial distribution of faecal samples of 24 infants at two, six and 12 weeks of age based on their OTU composition and using the estimated level of consumption (low, medium and high) for each HMO as explanatory variables. The red triangles represent centroids of each consumption group (high, medium and low) for each of the HMOs. For better image clarity only top twenty best fitted microbial taxa are displayed.

