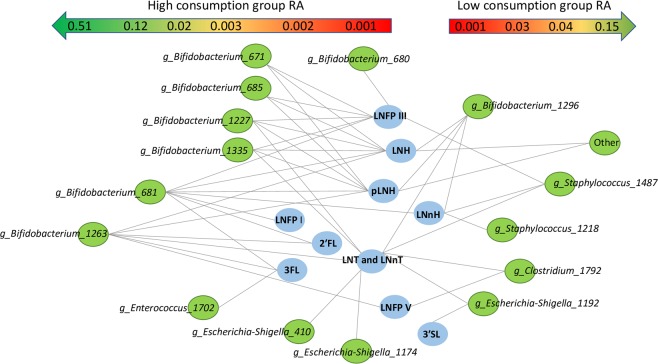
Figure 7.
Differentially abundant OTUs in faecal samples of infants classified into high or low HMO consumption categories for each HMO type (Kruskal-Wallis; FDR < 0.05). OTUs enriched in infants classified as high consumers are displayed on the left half of the figure, and OTUs enriched in infants classified as low consumers are displayed on the right half of the figure. The approximate RA of the OTUs is indicated by the gradient arrows on top of the figure.

