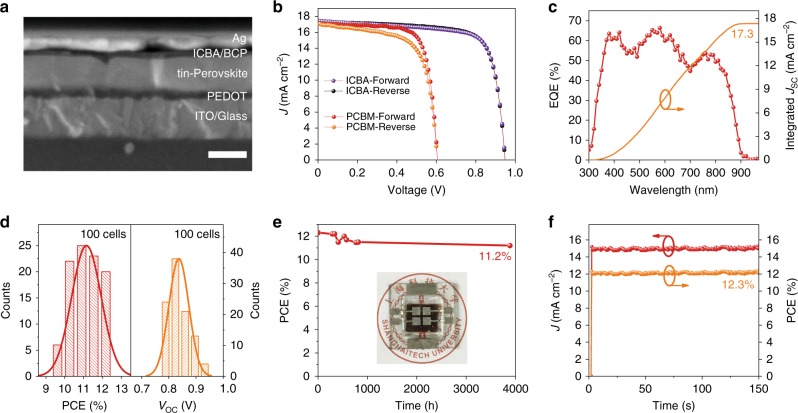
Fig. 3. Photovoltaic performances of tin PSCs.
a Cross-section SEM image of PEA15-SCN device. The scale bar is 200 nm. b J–V curves of the certified PEA15-SCN device with ICBA and champion device of PEA15-SCN film with PCBM. c EQE curve and integrated JSC of the certified PEA15-SCN device. d Histograms for PCE and VOC of PEA15-SCN device. e The stability of encapsulated PEA15-SCN device stored in N2 atmosphere. f Stabilized power output for the PEA15-SCN device (at 0.81 V) under simulated AM 1.5 G solar illumination at 100 mW cm−2.

