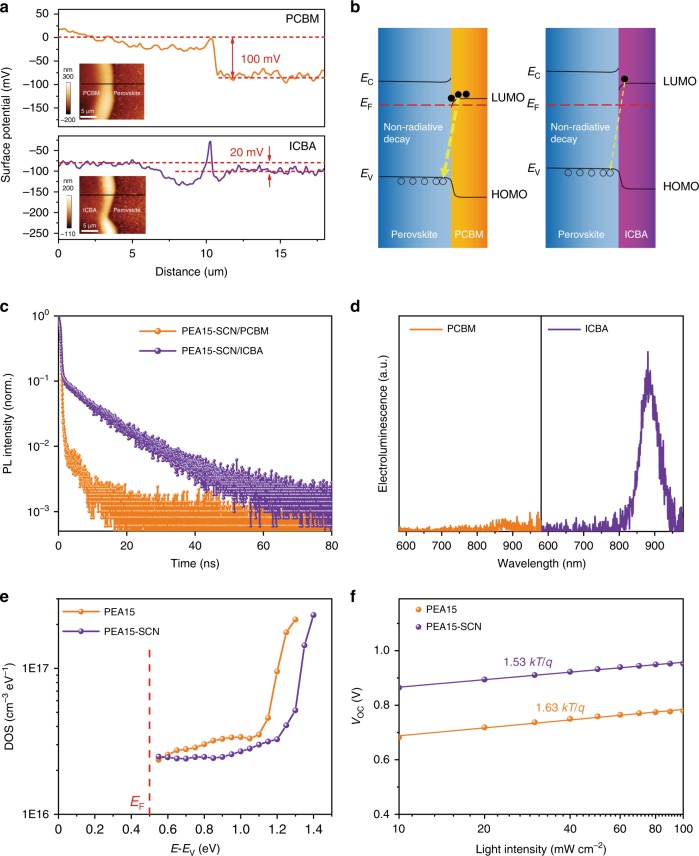
Fig. 4. Recombination and defect density characterization.
a Surface potential distribution of PEA15-SCN/PCBM and PEA15-SCN/ICBA from SKPM measurement. The insert images are AFM topography images for the corresponding samples. b The schematic diagrams of interface recombination for the two samples. c Time-resolved photoluminescence kinetics at 840 nm for the ITO/PEDOT/perovskite/ETL films after encapsulation. d Electroluminescence spectra of perovskite films under bias voltage of 2 V. e The density of states in the bandgap calculated from TPV and TPC. f VOC versus illumination intensity for the devices.

