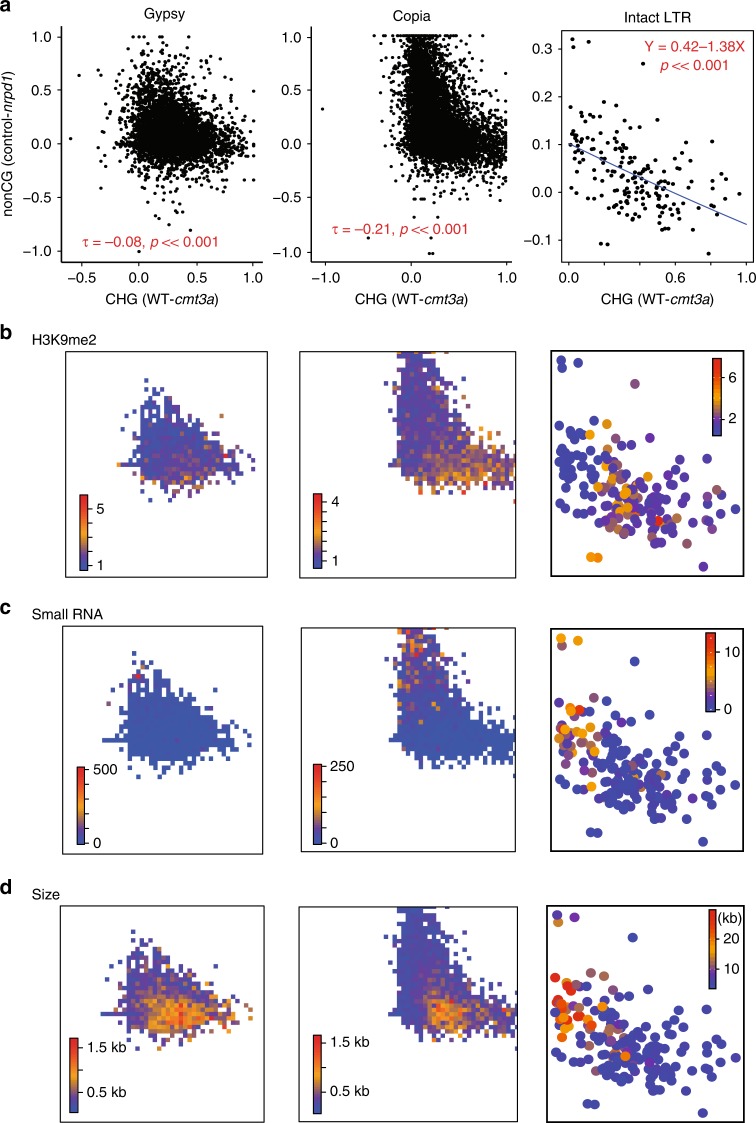
Fig. 3. CMT3a-mediated CHG methylation anti-correlates NRPD1-mediated non-CG methylation in distal LTR TEs.
a Scatter plots of hypomethylation of each TE. X-axis represents the reduction of CHG methylation in cmt3a, y-axis represents the reduction of non-CG methylation in nrpd1. Kendall’s tau test is performed for Gypsy and Copia. The Kendall rank correlation coefficients and p values relative to the null hypothesis of no correlation are indicated in red. Linear regression is performed for intact LTRs (the blue line). Regression model and the p-value relative to the null hypothesis that the line has zero gradient are indicated in red. b–d H3K9me2 (b), small RNA (c) and size (d) profiling of each TE. For Gypsy and Copia, color key represents average levels of H3K9me2 (b), small RNA (c) or size (d) of no less than three dots within each colored square. For intact LTR, color key represents levels of H3K9me2 (b), small RNA (c) or size (d) of each dot.

