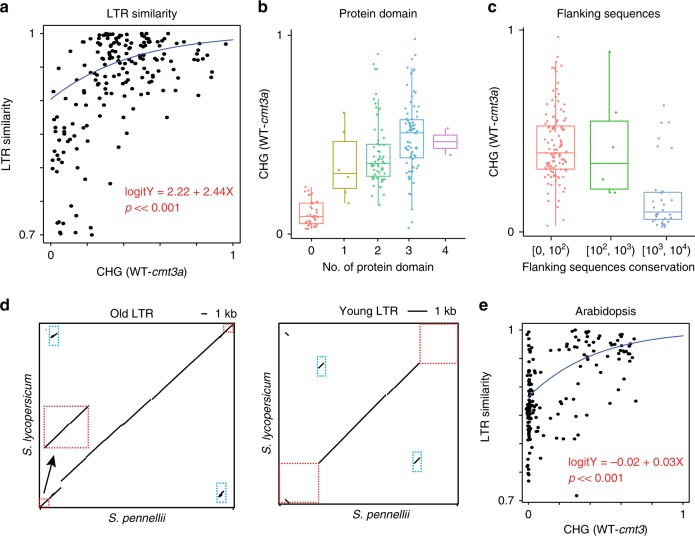
Fig. 4. CMT3a-targeted intact LTRs are evolutionarily younger elements.
a Scatter plot of distal intact LTRs. X-axis represents the reduction of CHG methylation in cmt3a, y-axis represents the 5′ and 3′ LTR similarity. Regression-blue line. The regression model and p value are indicated in red. The p value is relative to the null hypothesis of there being a gradient of zero and so no causal relationship between the reduction of CHG methylation in cmt3a and the 5′ and 3′ LTR similarity. b Correlation of number of predicted protein domains of each intact LTRs (x-axis) and reduction of CHG methylation in cmt3a (y-axis). c Alignments results of intact LTR flanking sequences (2 kb upstream and 2 kb downstream) between S. lycopersicum and S. pennellii. X-axis represents three ranges of the alignment score by BLASTn. Y-axis represents the reduction of CHG methylation in cmt3a. d Dot plots of each one example of old and young element comparing the LTR sequence from S. lycopersicum and its homologous sequence in S. pennellii genome, plus 2 kb upstream and downstream regions. Blue boxes highlight the 5′ and 3′ LTRs. Red boxes highlight the flanking regions. e Scatter plot of Arabidopsis distal intact LTRs. X-axis represents the reduction of CHG methylation in cmt3, y-axis represents the 5′ and 3′ LTR similarity. Regression-blue line. The regression model and p value are indicated in red. The p value is relative to the null hypothesis of there being a gradient of zero and so no causal relationship between the reduction of CHG methylation in cmt3 and the 5′ and 3′ LTR similarity.

