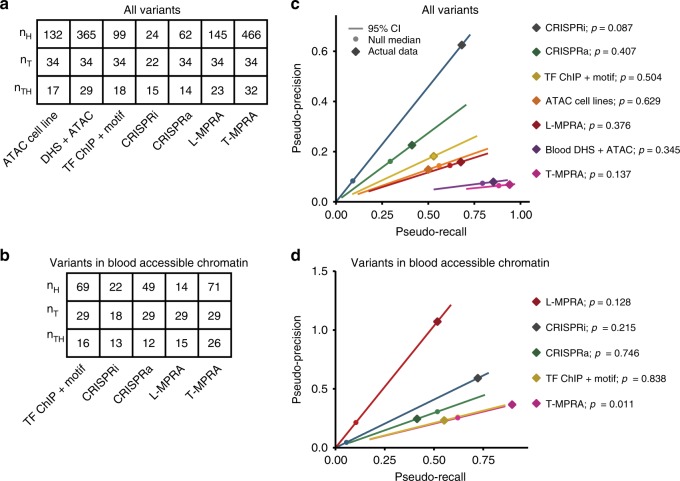
Fig. 3. Comparison of GWAS enrichment across methods.
a, b Values for nH, nT, and nTH for all methods, considering (a) all variants, and (b) only variants in open chromatin. c, d Pseudo-precision (y axes) and pseudo-recall (x axes) for GWAS enrichment for each assay (colors), with diamonds depicting the actual assay performance (as in Supplementary Fig. 9a), and the lines depicting the 95% CI of each assay’s null distribution (as in Supplementary Fig. 9b). Empirical one-sided P-values derived from the genomic-shifts null are indicated next to each assay label. P-values are not corrected for multiple hypothesis testing. c Each assay evaluated individually for all tested variants and d considering only SNPs in blood cell accessible chromatin. The relationship between pseudo-precision and pseudo-recall is linear in the null (pseudo-precision = (nT/nH) × pseudo-recall) because both are proportional to nTH and nT and nH are constant.

