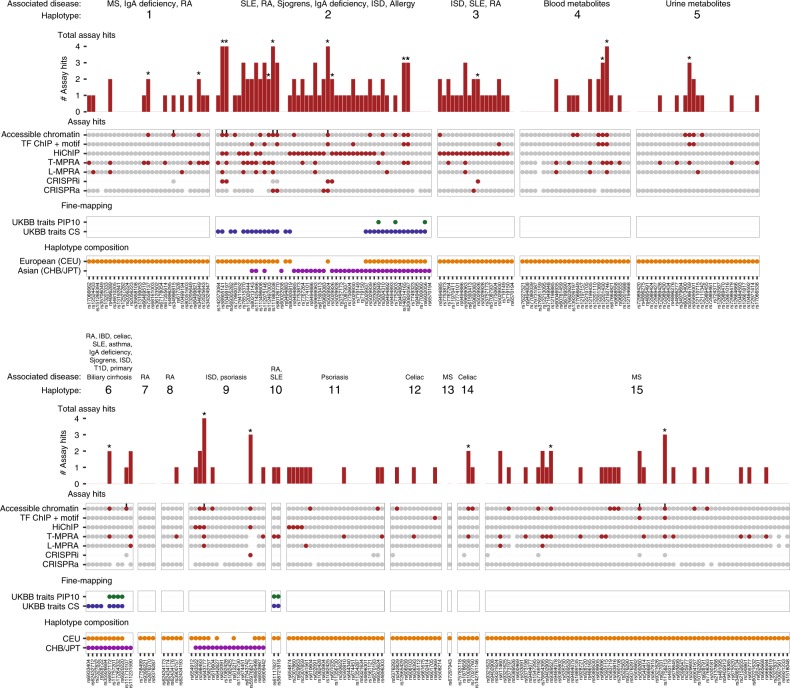
Fig. 4. Prioritizing variants on disease-associated haplotypes.
A summary of assay results and genetics data for all SNPs on each disease-associated haplotype. Each subpanel represents a different haplotype, with associated traits and the haplotype number are indicated on the top. For each SNP (x axes), the total number of assay hits is shown in the bar graph (top) with SNPs that are hits in CRISPRi or T-MPRA hits in accessible chromatin marked with an asterisk. Results from each assay are shown in the middle, with hits in red, and SNPs that are assayed but were not hits in gray for each of the seven assays (y-axis). The vertical black bars above accessible chromatin SNP status indicate SNPs that were in accessible chromatin in our tested cell lines. Fine-mapped immune-related traits from UK Biobank (UKBB), including SNPs in the 95% credible set (CS—blue) and those that have a posterior inclusion probability > 10% (PIP10—green) are second from the bottom. The population-specific SNPs contained within each disease-associated haplotype are indicated (bottom) with orange for European (CEU) and purple for East Asian (CHB/JPT). Also see Supplementary Data 3.

