Figure 3.
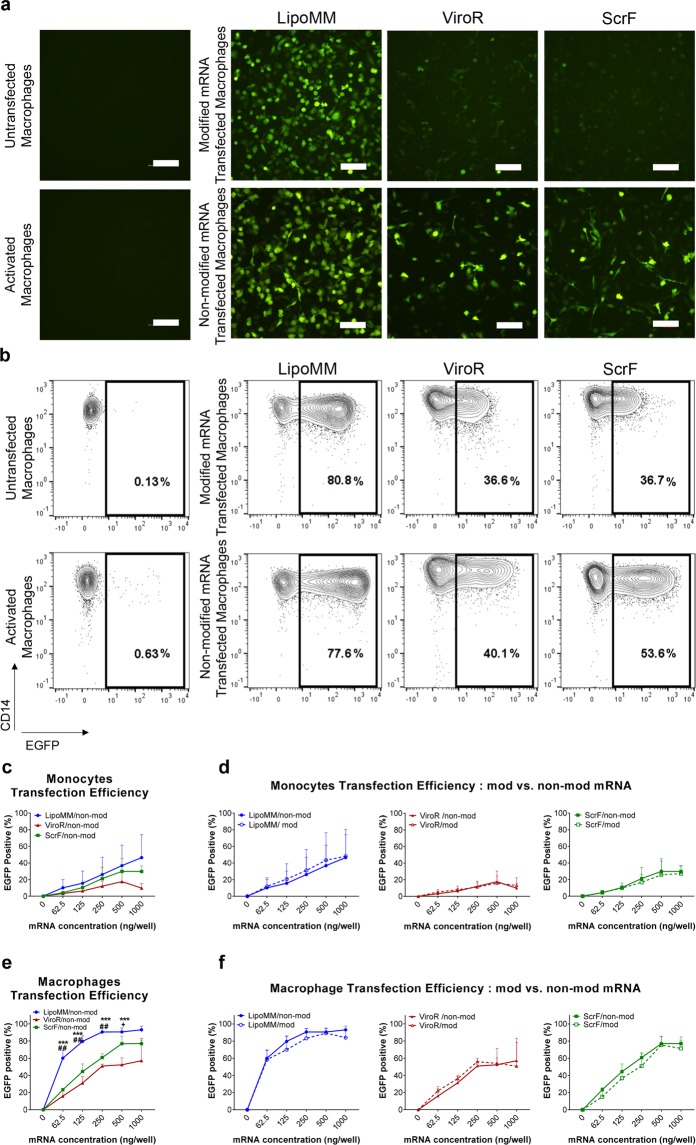
Transfection efficiency for monocytes and macrophages comparing LipoMM, ViroR, and ScrF; (a) Representative fluorescent microscopy images (bar = 100 µm) and (b) contour plots indicating EGFP expression of macrophages transfected with 125 ng/well of modified and non-modified mRNA via LipoMM, ViroR, and ScrF. (c) Quantification of EGFP positive cells as indicator of transfection efficiency for non-modified mRNA transfected monocytes and comparison of monocytes transfected with modified or non-modified mRNA using LipoMM, ViroR, and ScrF (d). The same comparison was performed for macrophages transfected with non-modified mRNA (e) and for macrophages transfected with modified or non-modified mRNA using LipoMM, ViroR, and ScrF (f). Values for no mRNA (0 ng/well) refer to untransfected cells throughout. “Activated” refers to cells treated with lipopolysaccharide (LPS) (2 µg·mL−1) and interferon gamma (IFN-γ) (10 ng·mL−1) for 24 h. Statistical differences in transfection efficiency is depicted with * for LipoMM vs. ViroR, # for LipoMM vs. ScrF and + for ViroR vs. ScrF. +p < 0.05, ##p < 0.01, ***p < 0.001; Values are presented as mean ± SD, n = 3. Error bars indicate SD.

